Luxembourger vs Ghanaian Currently Married
COMPARE
Luxembourger
Ghanaian
Currently Married
Currently Married Comparison
Luxembourgers
Ghanaians
49.3%
CURRENTLY MARRIED
99.8/ 100
METRIC RATING
20th/ 347
METRIC RANK
42.9%
CURRENTLY MARRIED
0.0/ 100
METRIC RATING
286th/ 347
METRIC RANK
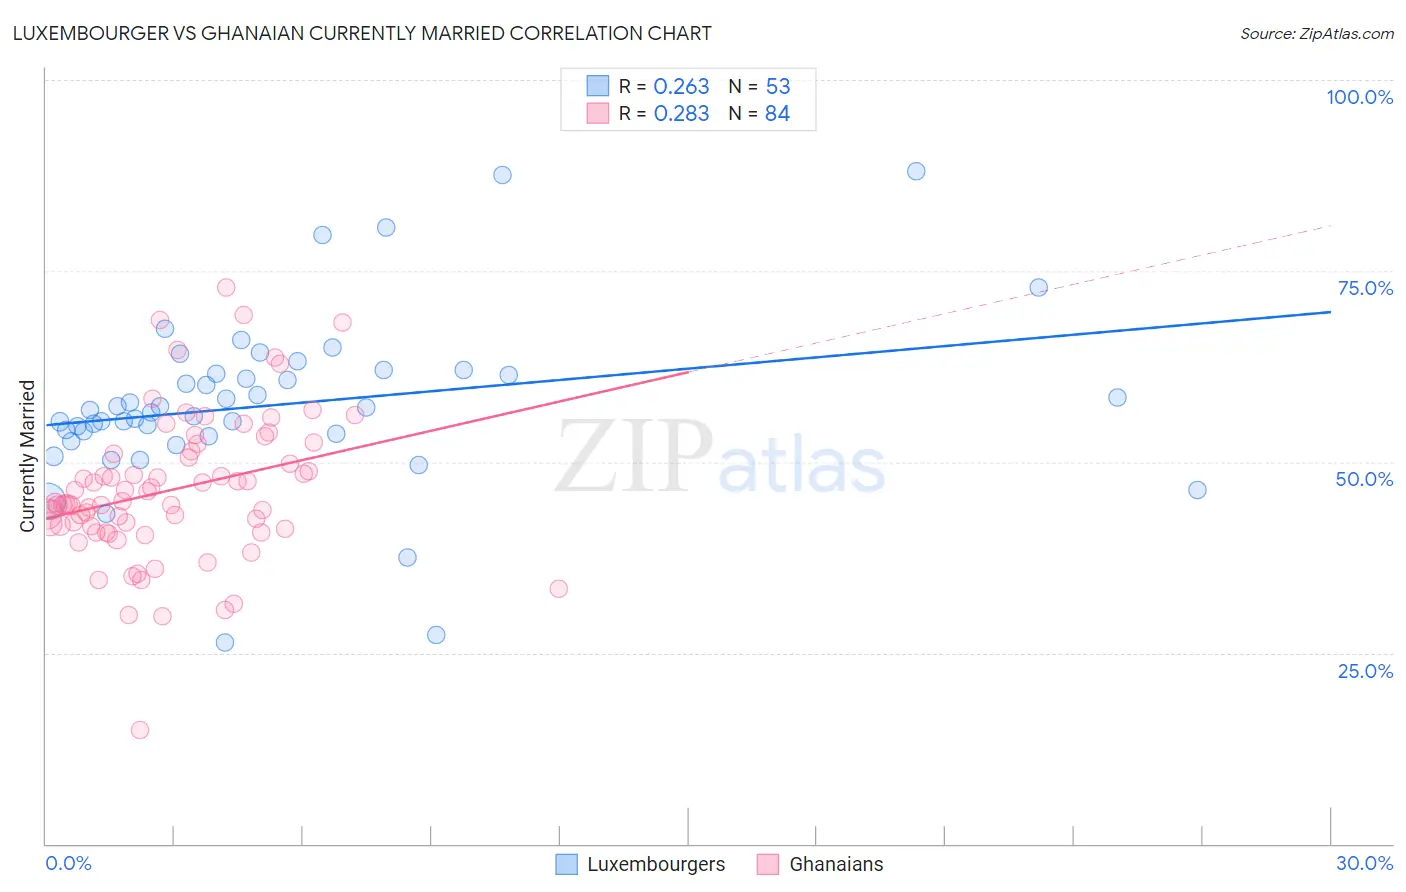
Luxembourger vs Ghanaian Currently Married Correlation Chart
The statistical analysis conducted on geographies consisting of 144,673,478 people shows a weak positive correlation between the proportion of Luxembourgers and percentage of population currently married in the United States with a correlation coefficient (R) of 0.263 and weighted average of 49.3%. Similarly, the statistical analysis conducted on geographies consisting of 190,682,082 people shows a weak positive correlation between the proportion of Ghanaians and percentage of population currently married in the United States with a correlation coefficient (R) of 0.283 and weighted average of 42.9%, a difference of 14.8%.
Currently Married Correlation Summary
| Measurement | Luxembourger | Ghanaian |
| Minimum | 26.3% | 14.9% |
| Maximum | 88.0% | 72.9% |
| Range | 61.7% | 58.0% |
| Mean | 57.5% | 46.3% |
| Median | 56.7% | 44.6% |
| Interquartile 25% (IQ1) | 53.5% | 41.5% |
| Interquartile 75% (IQ3) | 61.7% | 51.2% |
| Interquartile Range (IQR) | 8.2% | 9.8% |
| Standard Deviation (Sample) | 11.4% | 9.6% |
| Standard Deviation (Population) | 11.2% | 9.6% |
Similar Demographics by Currently Married
Demographics Similar to Luxembourgers by Currently Married
In terms of currently married, the demographic groups most similar to Luxembourgers are Scottish (49.2%, a difference of 0.11%), European (49.3%, a difference of 0.14%), Immigrants from Scotland (49.3%, a difference of 0.15%), Bulgarian (49.1%, a difference of 0.33%), and Scandinavian (49.5%, a difference of 0.44%).
| Demographics | Rating | Rank | Currently Married |
| Dutch | 99.9 /100 | #13 | Exceptional 49.6% |
| Germans | 99.9 /100 | #14 | Exceptional 49.6% |
| Pennsylvania Germans | 99.9 /100 | #15 | Exceptional 49.6% |
| Chinese | 99.9 /100 | #16 | Exceptional 49.5% |
| Scandinavians | 99.9 /100 | #17 | Exceptional 49.5% |
| Immigrants | Scotland | 99.8 /100 | #18 | Exceptional 49.3% |
| Europeans | 99.8 /100 | #19 | Exceptional 49.3% |
| Luxembourgers | 99.8 /100 | #20 | Exceptional 49.3% |
| Scottish | 99.8 /100 | #21 | Exceptional 49.2% |
| Bulgarians | 99.7 /100 | #22 | Exceptional 49.1% |
| Immigrants | Pakistan | 99.7 /100 | #23 | Exceptional 49.1% |
| Lithuanians | 99.6 /100 | #24 | Exceptional 49.0% |
| Maltese | 99.6 /100 | #25 | Exceptional 49.0% |
| Immigrants | Korea | 99.6 /100 | #26 | Exceptional 49.0% |
| Burmese | 99.6 /100 | #27 | Exceptional 48.9% |
Demographics Similar to Ghanaians by Currently Married
In terms of currently married, the demographic groups most similar to Ghanaians are Guatemalan (42.9%, a difference of 0.020%), Immigrants from Middle Africa (43.0%, a difference of 0.13%), Native/Alaskan (42.8%, a difference of 0.29%), Paiute (42.7%, a difference of 0.52%), and Immigrants from El Salvador (43.1%, a difference of 0.53%).
| Demographics | Rating | Rank | Currently Married |
| Central American Indians | 0.0 /100 | #279 | Tragic 43.3% |
| Apache | 0.0 /100 | #280 | Tragic 43.2% |
| Chippewa | 0.0 /100 | #281 | Tragic 43.2% |
| Immigrants | Ecuador | 0.0 /100 | #282 | Tragic 43.2% |
| Kiowa | 0.0 /100 | #283 | Tragic 43.2% |
| Immigrants | El Salvador | 0.0 /100 | #284 | Tragic 43.1% |
| Immigrants | Middle Africa | 0.0 /100 | #285 | Tragic 43.0% |
| Ghanaians | 0.0 /100 | #286 | Tragic 42.9% |
| Guatemalans | 0.0 /100 | #287 | Tragic 42.9% |
| Natives/Alaskans | 0.0 /100 | #288 | Tragic 42.8% |
| Paiute | 0.0 /100 | #289 | Tragic 42.7% |
| Immigrants | Ghana | 0.0 /100 | #290 | Tragic 42.7% |
| Immigrants | Guatemala | 0.0 /100 | #291 | Tragic 42.6% |
| Sub-Saharan Africans | 0.0 /100 | #292 | Tragic 42.6% |
| Yuman | 0.0 /100 | #293 | Tragic 42.6% |