Senegalese vs Iraqi Births to Unmarried Women
COMPARE
Senegalese
Iraqi
Births to Unmarried Women
Births to Unmarried Women Comparison
Senegalese
Iraqis
36.8%
BIRTHS TO UNMARRIED WOMEN
0.1/ 100
METRIC RATING
269th/ 347
METRIC RANK
27.6%
BIRTHS TO UNMARRIED WOMEN
99.6/ 100
METRIC RATING
41st/ 347
METRIC RANK
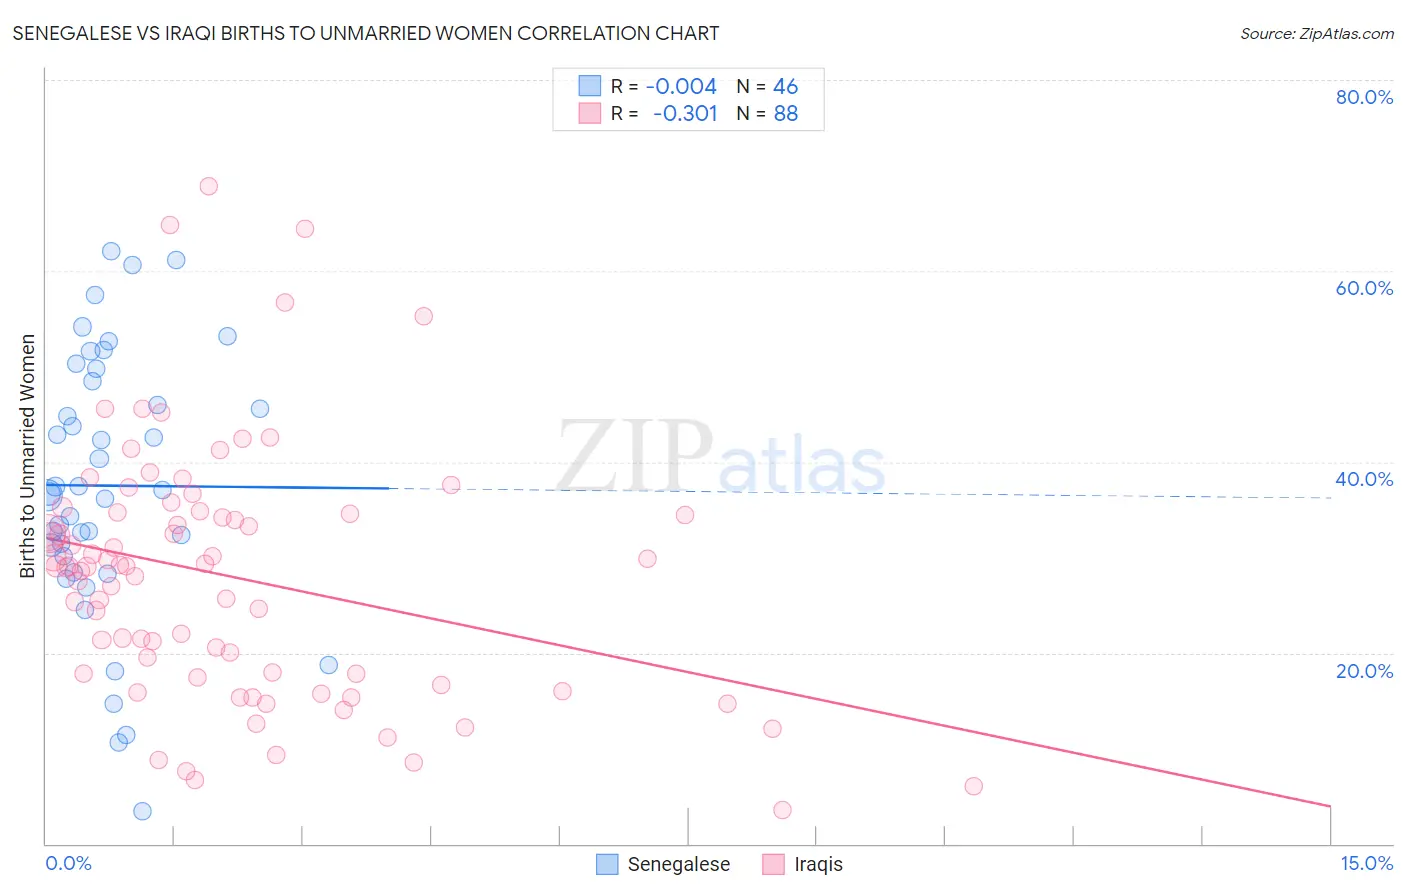
Senegalese vs Iraqi Births to Unmarried Women Correlation Chart
The statistical analysis conducted on geographies consisting of 77,154,598 people shows no correlation between the proportion of Senegalese and percentage of births to unmarried women in the United States with a correlation coefficient (R) of -0.004 and weighted average of 36.8%. Similarly, the statistical analysis conducted on geographies consisting of 164,715,067 people shows a mild negative correlation between the proportion of Iraqis and percentage of births to unmarried women in the United States with a correlation coefficient (R) of -0.301 and weighted average of 27.6%, a difference of 33.4%.
Births to Unmarried Women Correlation Summary
| Measurement | Senegalese | Iraqi |
| Minimum | 3.4% | 3.6% |
| Maximum | 62.0% | 68.9% |
| Range | 58.6% | 65.3% |
| Mean | 37.5% | 27.9% |
| Median | 36.8% | 29.0% |
| Interquartile 25% (IQ1) | 30.1% | 17.6% |
| Interquartile 75% (IQ3) | 48.4% | 34.6% |
| Interquartile Range (IQR) | 18.3% | 17.0% |
| Standard Deviation (Sample) | 13.8% | 13.3% |
| Standard Deviation (Population) | 13.7% | 13.2% |
Similar Demographics by Births to Unmarried Women
Demographics Similar to Senegalese by Births to Unmarried Women
In terms of births to unmarried women, the demographic groups most similar to Senegalese are Immigrants from Congo (36.8%, a difference of 0.080%), Immigrants from Barbados (36.8%, a difference of 0.10%), Comanche (36.7%, a difference of 0.12%), Central American (36.7%, a difference of 0.13%), and Immigrants from Senegal (36.7%, a difference of 0.20%).
| Demographics | Rating | Rank | Births to Unmarried Women |
| French American Indians | 0.1 /100 | #262 | Tragic 36.6% |
| Nicaraguans | 0.1 /100 | #263 | Tragic 36.6% |
| Sub-Saharan Africans | 0.1 /100 | #264 | Tragic 36.7% |
| Cherokee | 0.1 /100 | #265 | Tragic 36.7% |
| Immigrants | Senegal | 0.1 /100 | #266 | Tragic 36.7% |
| Central Americans | 0.1 /100 | #267 | Tragic 36.7% |
| Comanche | 0.1 /100 | #268 | Tragic 36.7% |
| Senegalese | 0.1 /100 | #269 | Tragic 36.8% |
| Immigrants | Congo | 0.1 /100 | #270 | Tragic 36.8% |
| Immigrants | Barbados | 0.1 /100 | #271 | Tragic 36.8% |
| Choctaw | 0.1 /100 | #272 | Tragic 36.9% |
| Mexicans | 0.1 /100 | #273 | Tragic 36.9% |
| Cree | 0.1 /100 | #274 | Tragic 37.0% |
| Barbadians | 0.1 /100 | #275 | Tragic 37.0% |
| Belizeans | 0.1 /100 | #276 | Tragic 37.0% |
Demographics Similar to Iraqis by Births to Unmarried Women
In terms of births to unmarried women, the demographic groups most similar to Iraqis are Immigrants from Eastern Europe (27.6%, a difference of 0.020%), Immigrants from Bulgaria (27.6%, a difference of 0.24%), Turkish (27.4%, a difference of 0.41%), Immigrants from Indonesia (27.7%, a difference of 0.51%), and Latvian (27.7%, a difference of 0.60%).
| Demographics | Rating | Rank | Births to Unmarried Women |
| Immigrants | Pakistan | 99.8 /100 | #34 | Exceptional 27.2% |
| Immigrants | Ireland | 99.7 /100 | #35 | Exceptional 27.2% |
| Immigrants | Western Asia | 99.7 /100 | #36 | Exceptional 27.2% |
| Immigrants | Ukraine | 99.7 /100 | #37 | Exceptional 27.2% |
| Immigrants | Moldova | 99.7 /100 | #38 | Exceptional 27.3% |
| Immigrants | Malaysia | 99.7 /100 | #39 | Exceptional 27.4% |
| Turks | 99.6 /100 | #40 | Exceptional 27.4% |
| Iraqis | 99.6 /100 | #41 | Exceptional 27.6% |
| Immigrants | Eastern Europe | 99.6 /100 | #42 | Exceptional 27.6% |
| Immigrants | Bulgaria | 99.6 /100 | #43 | Exceptional 27.6% |
| Immigrants | Indonesia | 99.5 /100 | #44 | Exceptional 27.7% |
| Latvians | 99.5 /100 | #45 | Exceptional 27.7% |
| Immigrants | Lithuania | 99.5 /100 | #46 | Exceptional 27.7% |
| Hmong | 99.5 /100 | #47 | Exceptional 27.7% |
| Eastern Europeans | 99.5 /100 | #48 | Exceptional 27.7% |