Senegalese vs Estonian Married-couple Households
COMPARE
Senegalese
Estonian
Married-couple Households
Married-couple Households Comparison
Senegalese
Estonians
38.6%
MARRIED-COUPLE HOUSEHOLDS
0.0/ 100
METRIC RATING
335th/ 347
METRIC RANK
47.7%
MARRIED-COUPLE HOUSEHOLDS
94.7/ 100
METRIC RATING
107th/ 347
METRIC RANK
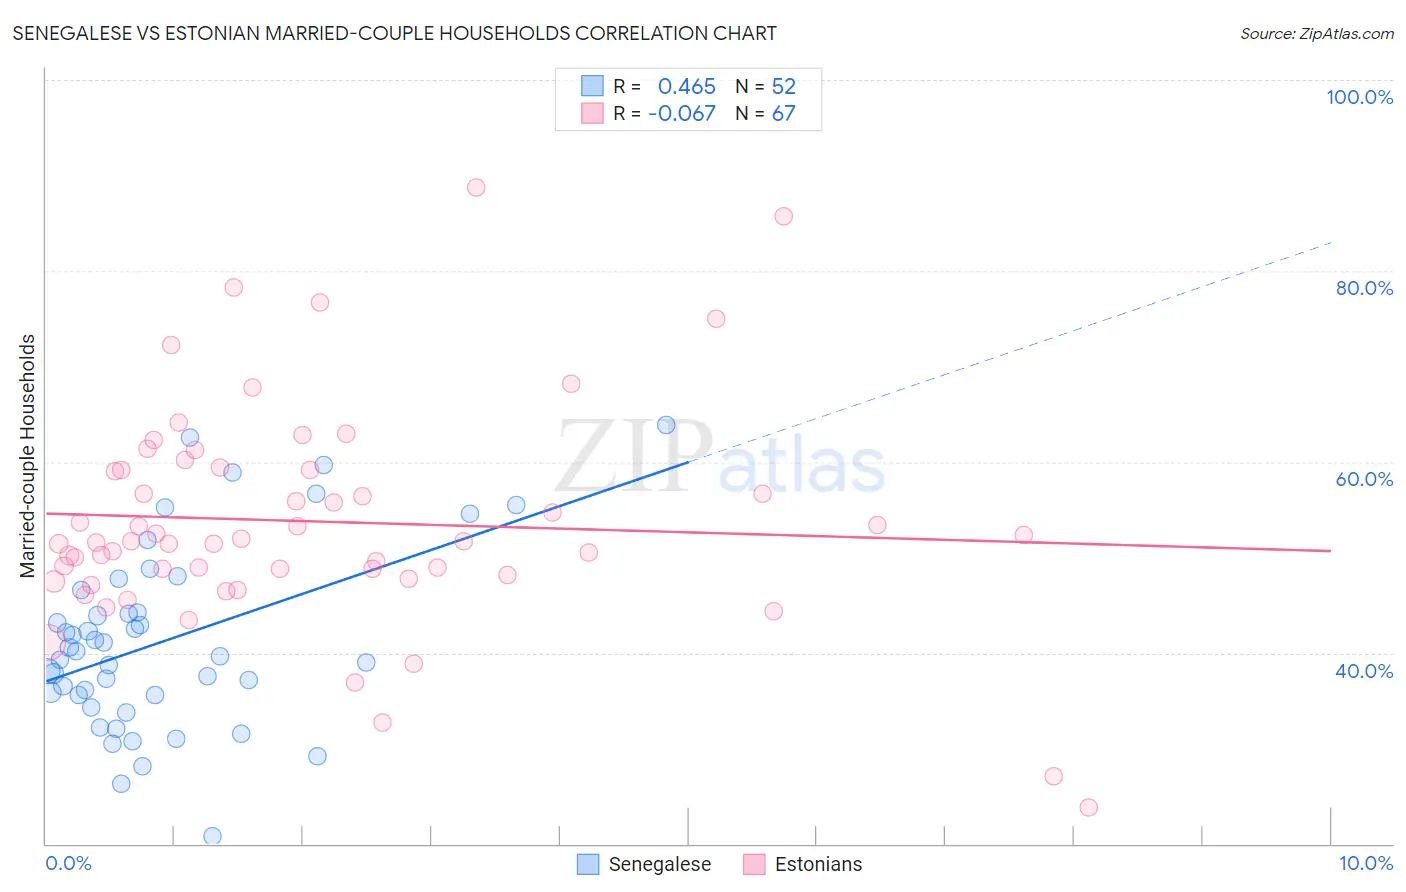
Senegalese vs Estonian Married-couple Households Correlation Chart
The statistical analysis conducted on geographies consisting of 78,113,781 people shows a moderate positive correlation between the proportion of Senegalese and percentage of married-couple family households in the United States with a correlation coefficient (R) of 0.465 and weighted average of 38.6%. Similarly, the statistical analysis conducted on geographies consisting of 123,500,387 people shows a slight negative correlation between the proportion of Estonians and percentage of married-couple family households in the United States with a correlation coefficient (R) of -0.067 and weighted average of 47.7%, a difference of 23.7%.
Married-couple Households Correlation Summary
| Measurement | Senegalese | Estonian |
| Minimum | 20.8% | 23.8% |
| Maximum | 63.9% | 88.8% |
| Range | 43.0% | 65.0% |
| Mean | 41.2% | 53.8% |
| Median | 39.9% | 51.7% |
| Interquartile 25% (IQ1) | 35.6% | 48.1% |
| Interquartile 75% (IQ3) | 45.5% | 59.1% |
| Interquartile Range (IQR) | 9.8% | 11.0% |
| Standard Deviation (Sample) | 9.5% | 11.6% |
| Standard Deviation (Population) | 9.4% | 11.5% |
Similar Demographics by Married-couple Households
Demographics Similar to Senegalese by Married-couple Households
In terms of married-couple households, the demographic groups most similar to Senegalese are Black/African American (38.5%, a difference of 0.18%), Immigrants from Somalia (38.4%, a difference of 0.32%), Immigrants from St. Vincent and the Grenadines (38.7%, a difference of 0.33%), Immigrants from Senegal (38.4%, a difference of 0.48%), and British West Indian (38.3%, a difference of 0.61%).
| Demographics | Rating | Rank | Married-couple Households |
| Barbadians | 0.0 /100 | #328 | Tragic 39.4% |
| Immigrants | Dominica | 0.0 /100 | #329 | Tragic 39.4% |
| Immigrants | Barbados | 0.0 /100 | #330 | Tragic 39.2% |
| Immigrants | Congo | 0.0 /100 | #331 | Tragic 39.0% |
| Somalis | 0.0 /100 | #332 | Tragic 39.0% |
| Immigrants | West Indies | 0.0 /100 | #333 | Tragic 39.0% |
| Immigrants | St. Vincent and the Grenadines | 0.0 /100 | #334 | Tragic 38.7% |
| Senegalese | 0.0 /100 | #335 | Tragic 38.6% |
| Blacks/African Americans | 0.0 /100 | #336 | Tragic 38.5% |
| Immigrants | Somalia | 0.0 /100 | #337 | Tragic 38.4% |
| Immigrants | Senegal | 0.0 /100 | #338 | Tragic 38.4% |
| British West Indians | 0.0 /100 | #339 | Tragic 38.3% |
| Dominicans | 0.0 /100 | #340 | Tragic 38.2% |
| Cape Verdeans | 0.0 /100 | #341 | Tragic 38.1% |
| Tohono O'odham | 0.0 /100 | #342 | Tragic 37.9% |
Demographics Similar to Estonians by Married-couple Households
In terms of married-couple households, the demographic groups most similar to Estonians are Immigrants from Japan (47.7%, a difference of 0.050%), Immigrants from Jordan (47.7%, a difference of 0.10%), Macedonian (47.6%, a difference of 0.12%), Syrian (47.6%, a difference of 0.13%), and Peruvian (47.6%, a difference of 0.14%).
| Demographics | Rating | Rank | Married-couple Households |
| Immigrants | Italy | 96.3 /100 | #100 | Exceptional 47.9% |
| Turks | 96.1 /100 | #101 | Exceptional 47.8% |
| Slavs | 96.0 /100 | #102 | Exceptional 47.8% |
| Hawaiians | 96.0 /100 | #103 | Exceptional 47.8% |
| Immigrants | South Africa | 96.0 /100 | #104 | Exceptional 47.8% |
| Immigrants | Czechoslovakia | 95.5 /100 | #105 | Exceptional 47.8% |
| Portuguese | 95.5 /100 | #106 | Exceptional 47.8% |
| Estonians | 94.7 /100 | #107 | Exceptional 47.7% |
| Immigrants | Japan | 94.4 /100 | #108 | Exceptional 47.7% |
| Immigrants | Jordan | 94.1 /100 | #109 | Exceptional 47.7% |
| Macedonians | 93.9 /100 | #110 | Exceptional 47.6% |
| Syrians | 93.9 /100 | #111 | Exceptional 47.6% |
| Peruvians | 93.8 /100 | #112 | Exceptional 47.6% |
| Venezuelans | 93.8 /100 | #113 | Exceptional 47.6% |
| Immigrants | Europe | 93.7 /100 | #114 | Exceptional 47.6% |