Senegalese vs Estonian Nursery School
COMPARE
Senegalese
Estonian
Nursery School
Nursery School Comparison
Senegalese
Estonians
97.7%
NURSERY SCHOOL
3.2/ 100
METRIC RATING
229th/ 347
METRIC RANK
98.5%
NURSERY SCHOOL
99.8/ 100
METRIC RATING
51st/ 347
METRIC RANK
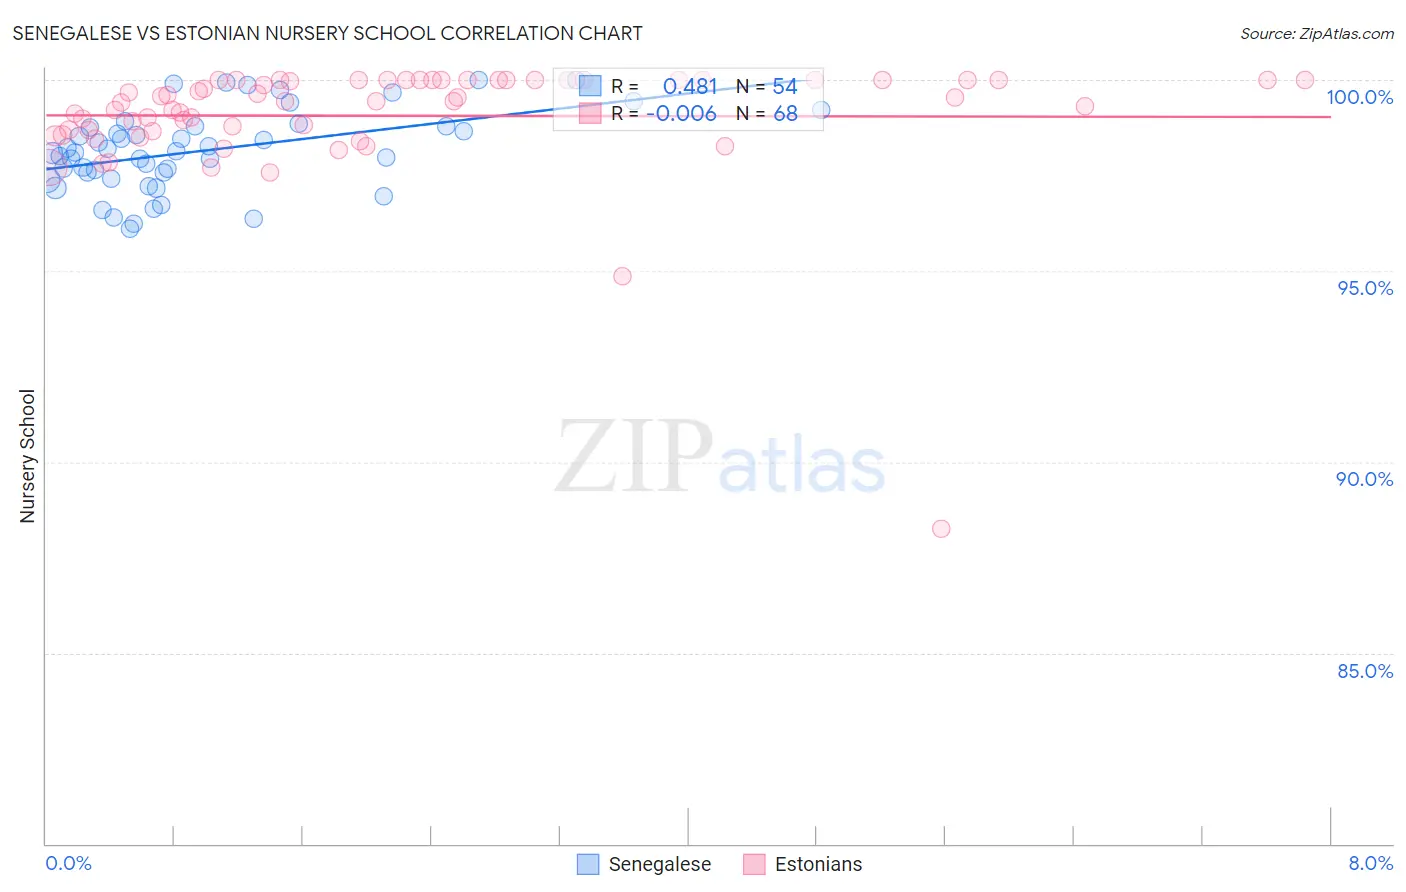
Senegalese vs Estonian Nursery School Correlation Chart
The statistical analysis conducted on geographies consisting of 78,142,569 people shows a moderate positive correlation between the proportion of Senegalese and percentage of population with at least nursery school education in the United States with a correlation coefficient (R) of 0.481 and weighted average of 97.7%. Similarly, the statistical analysis conducted on geographies consisting of 123,528,404 people shows no correlation between the proportion of Estonians and percentage of population with at least nursery school education in the United States with a correlation coefficient (R) of -0.006 and weighted average of 98.5%, a difference of 0.74%.
Nursery School Correlation Summary
| Measurement | Senegalese | Estonian |
| Minimum | 96.1% | 88.3% |
| Maximum | 100.0% | 100.0% |
| Range | 3.9% | 11.7% |
| Mean | 98.2% | 99.1% |
| Median | 98.1% | 99.4% |
| Interquartile 25% (IQ1) | 97.6% | 98.7% |
| Interquartile 75% (IQ3) | 98.8% | 100.0% |
| Interquartile Range (IQR) | 1.2% | 1.3% |
| Standard Deviation (Sample) | 1.0% | 1.6% |
| Standard Deviation (Population) | 1.0% | 1.6% |
Similar Demographics by Nursery School
Demographics Similar to Senegalese by Nursery School
In terms of nursery school, the demographic groups most similar to Senegalese are Subsaharan African (97.7%, a difference of 0.0%), Sudanese (97.7%, a difference of 0.0%), Immigrants from Nepal (97.7%, a difference of 0.010%), Immigrants from Costa Rica (97.7%, a difference of 0.010%), and Iraqi (97.7%, a difference of 0.010%).
| Demographics | Rating | Rank | Nursery School |
| Immigrants | Syria | 4.0 /100 | #222 | Tragic 97.7% |
| Immigrants | Sudan | 3.9 /100 | #223 | Tragic 97.7% |
| Immigrants | Nepal | 3.6 /100 | #224 | Tragic 97.7% |
| Immigrants | Costa Rica | 3.5 /100 | #225 | Tragic 97.7% |
| Iraqis | 3.5 /100 | #226 | Tragic 97.7% |
| Sub-Saharan Africans | 3.2 /100 | #227 | Tragic 97.7% |
| Sudanese | 3.2 /100 | #228 | Tragic 97.7% |
| Senegalese | 3.2 /100 | #229 | Tragic 97.7% |
| Sierra Leoneans | 2.9 /100 | #230 | Tragic 97.7% |
| Puerto Ricans | 2.6 /100 | #231 | Tragic 97.7% |
| Immigrants | Uruguay | 2.3 /100 | #232 | Tragic 97.7% |
| U.S. Virgin Islanders | 2.1 /100 | #233 | Tragic 97.7% |
| Colombians | 2.1 /100 | #234 | Tragic 97.7% |
| Immigrants | Pakistan | 2.1 /100 | #235 | Tragic 97.7% |
| Immigrants | Malaysia | 1.9 /100 | #236 | Tragic 97.7% |
Demographics Similar to Estonians by Nursery School
In terms of nursery school, the demographic groups most similar to Estonians are White/Caucasian (98.5%, a difference of 0.0%), Celtic (98.5%, a difference of 0.0%), Australian (98.5%, a difference of 0.0%), Czechoslovakian (98.5%, a difference of 0.010%), and Ottawa (98.5%, a difference of 0.010%).
| Demographics | Rating | Rank | Nursery School |
| Belgians | 99.9 /100 | #44 | Exceptional 98.5% |
| Northern Europeans | 99.9 /100 | #45 | Exceptional 98.5% |
| Hungarians | 99.9 /100 | #46 | Exceptional 98.5% |
| Czechoslovakians | 99.9 /100 | #47 | Exceptional 98.5% |
| Ottawa | 99.8 /100 | #48 | Exceptional 98.5% |
| Whites/Caucasians | 99.8 /100 | #49 | Exceptional 98.5% |
| Celtics | 99.8 /100 | #50 | Exceptional 98.5% |
| Estonians | 99.8 /100 | #51 | Exceptional 98.5% |
| Australians | 99.8 /100 | #52 | Exceptional 98.5% |
| Kiowa | 99.8 /100 | #53 | Exceptional 98.4% |
| Pueblo | 99.8 /100 | #54 | Exceptional 98.4% |
| Immigrants | Scotland | 99.8 /100 | #55 | Exceptional 98.4% |
| Americans | 99.8 /100 | #56 | Exceptional 98.4% |
| Austrians | 99.8 /100 | #57 | Exceptional 98.4% |
| Bulgarians | 99.8 /100 | #58 | Exceptional 98.4% |