Seminole vs Kiowa Single Mother Households
COMPARE
Seminole
Kiowa
Single Mother Households
Single Mother Households Comparison
Seminole
Kiowa
7.4%
SINGLE MOTHER HOUSEHOLDS
0.2/ 100
METRIC RATING
256th/ 347
METRIC RANK
7.1%
SINGLE MOTHER HOUSEHOLDS
0.8/ 100
METRIC RATING
239th/ 347
METRIC RANK
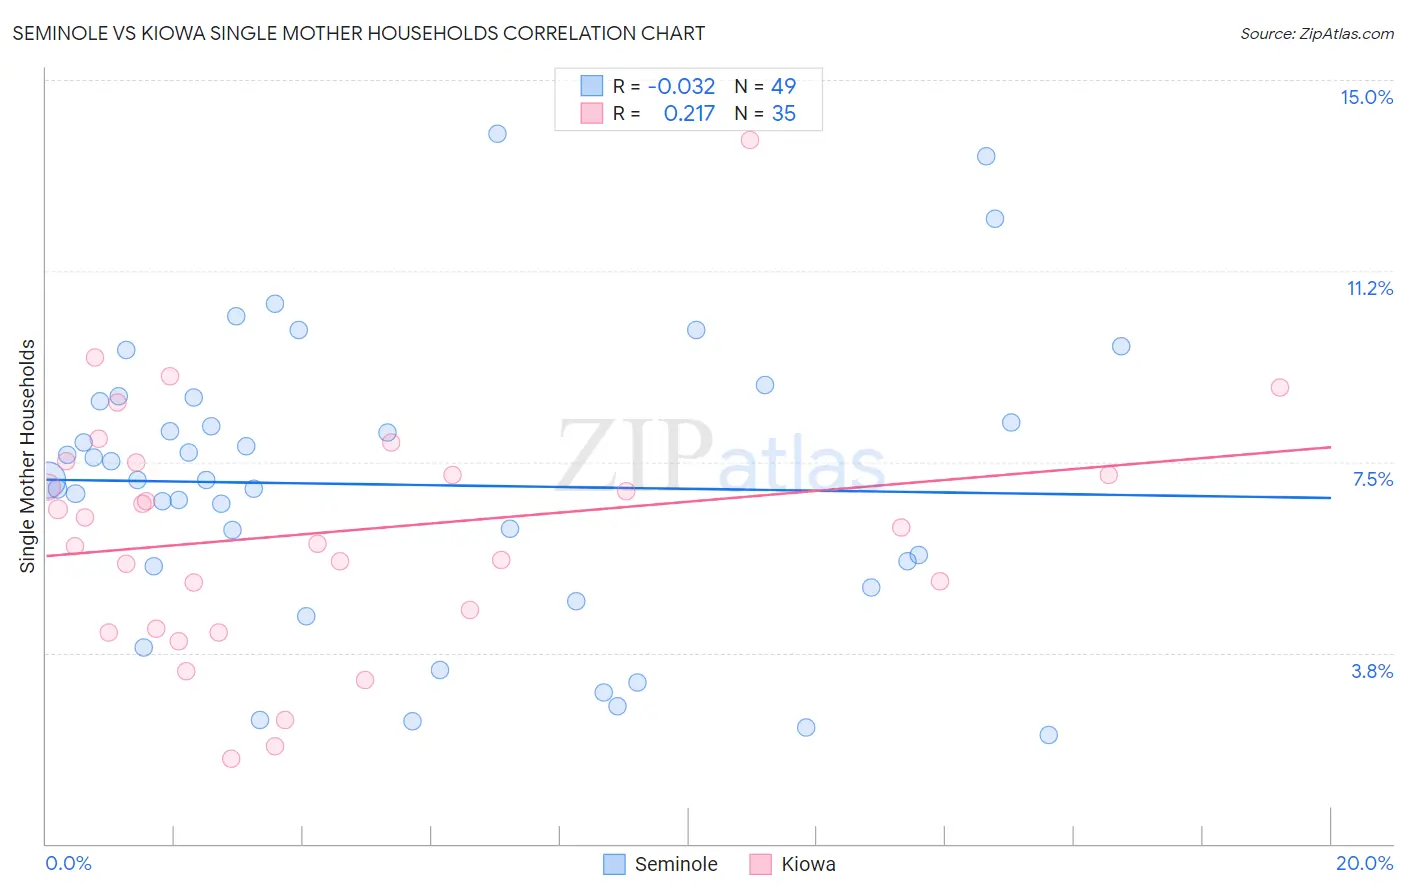
Seminole vs Kiowa Single Mother Households Correlation Chart
The statistical analysis conducted on geographies consisting of 118,254,419 people shows no correlation between the proportion of Seminole and percentage of single mother households in the United States with a correlation coefficient (R) of -0.032 and weighted average of 7.4%. Similarly, the statistical analysis conducted on geographies consisting of 56,080,330 people shows a weak positive correlation between the proportion of Kiowa and percentage of single mother households in the United States with a correlation coefficient (R) of 0.217 and weighted average of 7.1%, a difference of 3.5%.
Single Mother Households Correlation Summary
| Measurement | Seminole | Kiowa |
| Minimum | 2.1% | 1.7% |
| Maximum | 13.9% | 13.8% |
| Range | 11.8% | 12.2% |
| Mean | 7.0% | 6.1% |
| Median | 7.2% | 6.2% |
| Interquartile 25% (IQ1) | 5.2% | 4.2% |
| Interquartile 75% (IQ3) | 8.7% | 7.5% |
| Interquartile Range (IQR) | 3.5% | 3.3% |
| Standard Deviation (Sample) | 2.8% | 2.4% |
| Standard Deviation (Population) | 2.8% | 2.4% |
Demographics Similar to Seminole and Kiowa by Single Mother Households
In terms of single mother households, the demographic groups most similar to Seminole are Alaska Native (7.4%, a difference of 0.040%), Mexican American Indian (7.4%, a difference of 0.36%), Immigrants from Ecuador (7.3%, a difference of 0.73%), Cajun (7.3%, a difference of 0.78%), and Alaskan Athabascan (7.3%, a difference of 1.2%). Similarly, the demographic groups most similar to Kiowa are Panamanian (7.1%, a difference of 0.27%), Immigrants from Panama (7.2%, a difference of 0.32%), Arapaho (7.1%, a difference of 0.41%), Immigrants from Portugal (7.2%, a difference of 0.67%), and Fijian (7.2%, a difference of 0.75%).
| Demographics | Rating | Rank | Single Mother Households |
| Arapaho | 1.0 /100 | #237 | Tragic 7.1% |
| Panamanians | 0.9 /100 | #238 | Tragic 7.1% |
| Kiowa | 0.8 /100 | #239 | Tragic 7.1% |
| Immigrants | Panama | 0.7 /100 | #240 | Tragic 7.2% |
| Immigrants | Portugal | 0.6 /100 | #241 | Tragic 7.2% |
| Fijians | 0.6 /100 | #242 | Tragic 7.2% |
| Ecuadorians | 0.6 /100 | #243 | Tragic 7.2% |
| Cubans | 0.6 /100 | #244 | Tragic 7.2% |
| Immigrants | Cambodia | 0.5 /100 | #245 | Tragic 7.2% |
| Nicaraguans | 0.5 /100 | #246 | Tragic 7.2% |
| Dutch West Indians | 0.4 /100 | #247 | Tragic 7.3% |
| Spanish American Indians | 0.4 /100 | #248 | Tragic 7.3% |
| Bermudans | 0.4 /100 | #249 | Tragic 7.3% |
| Immigrants | Africa | 0.4 /100 | #250 | Tragic 7.3% |
| Malaysians | 0.3 /100 | #251 | Tragic 7.3% |
| Alaskan Athabascans | 0.3 /100 | #252 | Tragic 7.3% |
| Cajuns | 0.3 /100 | #253 | Tragic 7.3% |
| Immigrants | Ecuador | 0.3 /100 | #254 | Tragic 7.3% |
| Mexican American Indians | 0.2 /100 | #255 | Tragic 7.4% |
| Seminole | 0.2 /100 | #256 | Tragic 7.4% |
| Alaska Natives | 0.2 /100 | #257 | Tragic 7.4% |