Seminole vs Immigrants from Bosnia and Herzegovina Single Mother Households
COMPARE
Seminole
Immigrants from Bosnia and Herzegovina
Single Mother Households
Single Mother Households Comparison
Seminole
Immigrants from Bosnia and Herzegovina
7.4%
SINGLE MOTHER HOUSEHOLDS
0.2/ 100
METRIC RATING
256th/ 347
METRIC RANK
6.3%
SINGLE MOTHER HOUSEHOLDS
44.3/ 100
METRIC RATING
176th/ 347
METRIC RANK
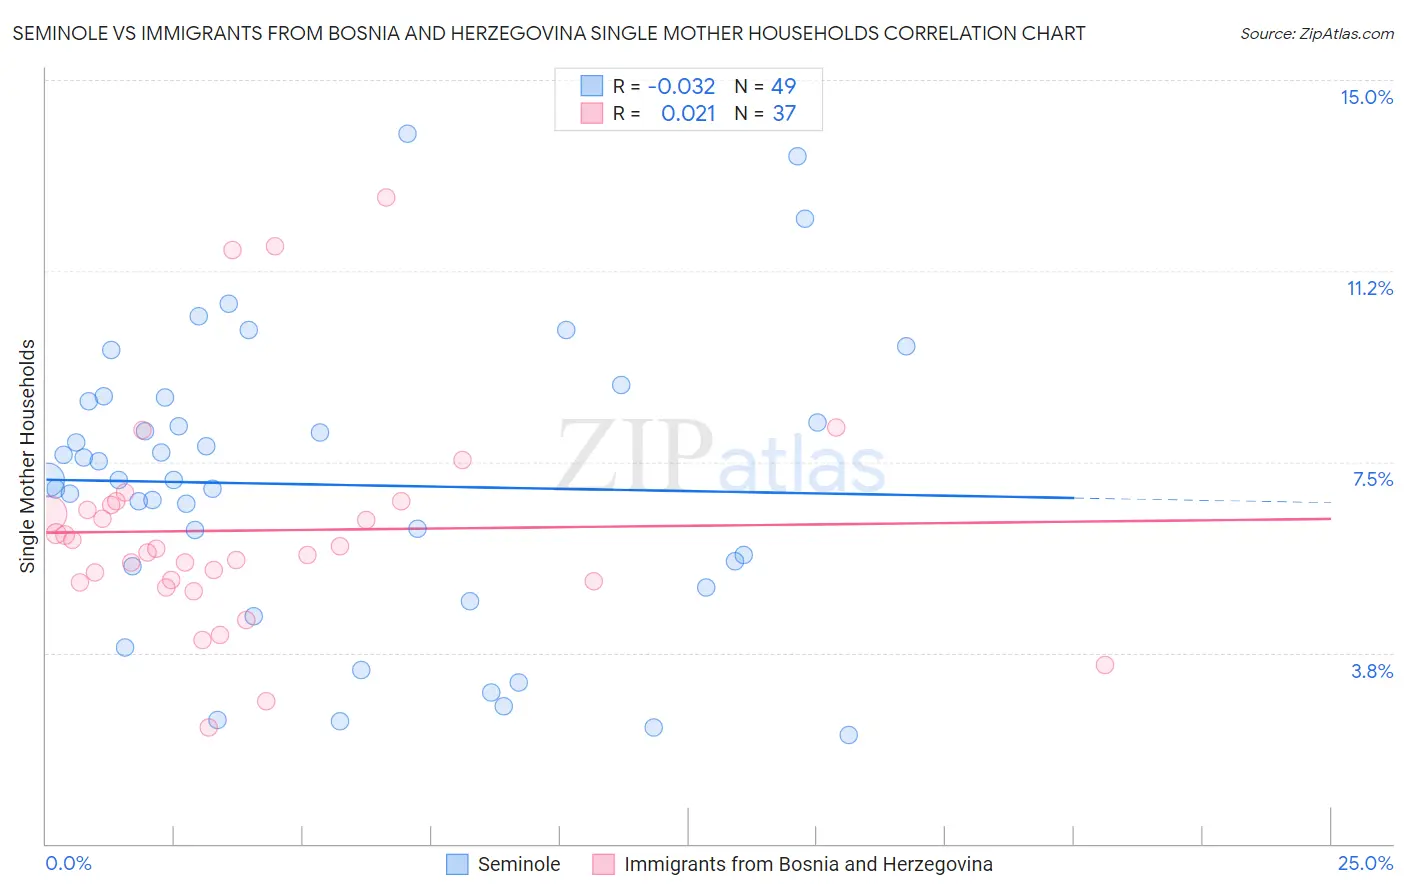
Seminole vs Immigrants from Bosnia and Herzegovina Single Mother Households Correlation Chart
The statistical analysis conducted on geographies consisting of 118,254,419 people shows no correlation between the proportion of Seminole and percentage of single mother households in the United States with a correlation coefficient (R) of -0.032 and weighted average of 7.4%. Similarly, the statistical analysis conducted on geographies consisting of 156,750,530 people shows no correlation between the proportion of Immigrants from Bosnia and Herzegovina and percentage of single mother households in the United States with a correlation coefficient (R) of 0.021 and weighted average of 6.3%, a difference of 16.4%.
Single Mother Households Correlation Summary
| Measurement | Seminole | Immigrants from Bosnia and Herzegovina |
| Minimum | 2.1% | 2.3% |
| Maximum | 13.9% | 12.7% |
| Range | 11.8% | 10.4% |
| Mean | 7.0% | 6.2% |
| Median | 7.2% | 5.8% |
| Interquartile 25% (IQ1) | 5.2% | 5.1% |
| Interquartile 75% (IQ3) | 8.7% | 6.7% |
| Interquartile Range (IQR) | 3.5% | 1.5% |
| Standard Deviation (Sample) | 2.8% | 2.2% |
| Standard Deviation (Population) | 2.8% | 2.1% |
Similar Demographics by Single Mother Households
Demographics Similar to Seminole by Single Mother Households
In terms of single mother households, the demographic groups most similar to Seminole are Alaska Native (7.4%, a difference of 0.040%), Pueblo (7.4%, a difference of 0.060%), Immigrants from Yemen (7.4%, a difference of 0.080%), Immigrants from Zaire (7.4%, a difference of 0.13%), and Japanese (7.4%, a difference of 0.15%).
| Demographics | Rating | Rank | Single Mother Households |
| Bermudans | 0.4 /100 | #249 | Tragic 7.3% |
| Immigrants | Africa | 0.4 /100 | #250 | Tragic 7.3% |
| Malaysians | 0.3 /100 | #251 | Tragic 7.3% |
| Alaskan Athabascans | 0.3 /100 | #252 | Tragic 7.3% |
| Cajuns | 0.3 /100 | #253 | Tragic 7.3% |
| Immigrants | Ecuador | 0.3 /100 | #254 | Tragic 7.3% |
| Mexican American Indians | 0.2 /100 | #255 | Tragic 7.4% |
| Seminole | 0.2 /100 | #256 | Tragic 7.4% |
| Alaska Natives | 0.2 /100 | #257 | Tragic 7.4% |
| Pueblo | 0.2 /100 | #258 | Tragic 7.4% |
| Immigrants | Yemen | 0.2 /100 | #259 | Tragic 7.4% |
| Immigrants | Zaire | 0.2 /100 | #260 | Tragic 7.4% |
| Japanese | 0.2 /100 | #261 | Tragic 7.4% |
| Immigrants | Somalia | 0.2 /100 | #262 | Tragic 7.4% |
| Immigrants | Nicaragua | 0.2 /100 | #263 | Tragic 7.4% |
Demographics Similar to Immigrants from Bosnia and Herzegovina by Single Mother Households
In terms of single mother households, the demographic groups most similar to Immigrants from Bosnia and Herzegovina are Osage (6.4%, a difference of 0.14%), Marshallese (6.3%, a difference of 0.16%), Portuguese (6.4%, a difference of 0.49%), Hmong (6.4%, a difference of 0.51%), and Immigrants from Morocco (6.3%, a difference of 0.62%).
| Demographics | Rating | Rank | Single Mother Households |
| Puget Sound Salish | 58.1 /100 | #169 | Average 6.3% |
| Immigrants | Oceania | 54.6 /100 | #170 | Average 6.3% |
| Afghans | 52.5 /100 | #171 | Average 6.3% |
| Immigrants | South Eastern Asia | 52.2 /100 | #172 | Average 6.3% |
| Immigrants | Vietnam | 51.5 /100 | #173 | Average 6.3% |
| Immigrants | Morocco | 50.0 /100 | #174 | Average 6.3% |
| Marshallese | 45.8 /100 | #175 | Average 6.3% |
| Immigrants | Bosnia and Herzegovina | 44.3 /100 | #176 | Average 6.3% |
| Osage | 43.0 /100 | #177 | Average 6.4% |
| Portuguese | 40.0 /100 | #178 | Fair 6.4% |
| Hmong | 39.8 /100 | #179 | Fair 6.4% |
| Immigrants | Nepal | 36.1 /100 | #180 | Fair 6.4% |
| Spanish | 33.4 /100 | #181 | Fair 6.4% |
| South American Indians | 33.4 /100 | #182 | Fair 6.4% |
| Spaniards | 27.8 /100 | #183 | Fair 6.5% |