Salvadoran vs Indian (Asian) Family Households with Children
COMPARE
Salvadoran
Indian (Asian)
Family Households with Children
Family Households with Children Comparison
Salvadorans
Indians (Asian)
29.9%
FAMILY HOUSEHOLDS WITH CHILDREN
100.0/ 100
METRIC RATING
18th/ 347
METRIC RANK
27.6%
FAMILY HOUSEHOLDS WITH CHILDREN
71.6/ 100
METRIC RATING
157th/ 347
METRIC RANK
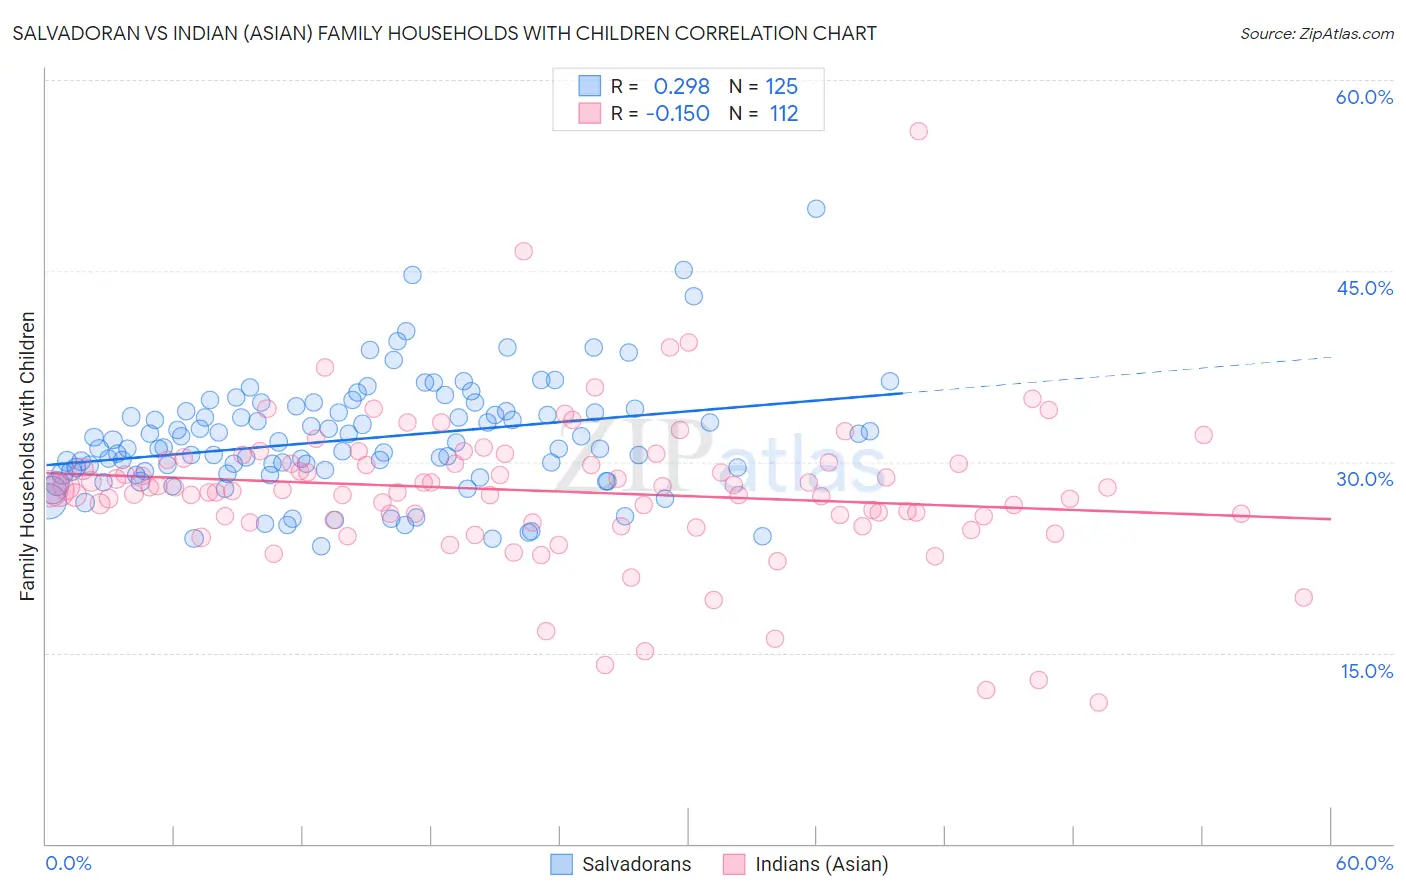
Salvadoran vs Indian (Asian) Family Households with Children Correlation Chart
The statistical analysis conducted on geographies consisting of 398,611,011 people shows a weak positive correlation between the proportion of Salvadorans and percentage of family households with children in the United States with a correlation coefficient (R) of 0.298 and weighted average of 29.9%. Similarly, the statistical analysis conducted on geographies consisting of 494,524,246 people shows a poor negative correlation between the proportion of Indians (Asian) and percentage of family households with children in the United States with a correlation coefficient (R) of -0.150 and weighted average of 27.6%, a difference of 8.2%.
Family Households with Children Correlation Summary
| Measurement | Salvadoran | Indian (Asian) |
| Minimum | 23.4% | 11.1% |
| Maximum | 49.9% | 55.9% |
| Range | 26.5% | 44.9% |
| Mean | 31.8% | 27.7% |
| Median | 31.1% | 27.8% |
| Interquartile 25% (IQ1) | 29.2% | 25.6% |
| Interquartile 75% (IQ3) | 34.0% | 29.9% |
| Interquartile Range (IQR) | 4.8% | 4.3% |
| Standard Deviation (Sample) | 4.5% | 5.9% |
| Standard Deviation (Population) | 4.5% | 5.9% |
Similar Demographics by Family Households with Children
Demographics Similar to Salvadorans by Family Households with Children
In terms of family households with children, the demographic groups most similar to Salvadorans are Alaska Native (29.9%, a difference of 0.040%), Immigrants from El Salvador (29.8%, a difference of 0.070%), Immigrants from Laos (29.8%, a difference of 0.11%), Malaysian (29.8%, a difference of 0.14%), and Hispanic or Latino (29.9%, a difference of 0.19%).
| Demographics | Rating | Rank | Family Households with Children |
| Nepalese | 100.0 /100 | #11 | Exceptional 30.5% |
| Immigrants | Pakistan | 100.0 /100 | #12 | Exceptional 30.2% |
| Afghans | 100.0 /100 | #13 | Exceptional 30.2% |
| Bangladeshis | 100.0 /100 | #14 | Exceptional 30.1% |
| Immigrants | South Central Asia | 100.0 /100 | #15 | Exceptional 30.0% |
| Immigrants | Afghanistan | 100.0 /100 | #16 | Exceptional 30.0% |
| Hispanics or Latinos | 100.0 /100 | #17 | Exceptional 29.9% |
| Salvadorans | 100.0 /100 | #18 | Exceptional 29.9% |
| Alaska Natives | 100.0 /100 | #19 | Exceptional 29.9% |
| Immigrants | El Salvador | 100.0 /100 | #20 | Exceptional 29.8% |
| Immigrants | Laos | 100.0 /100 | #21 | Exceptional 29.8% |
| Malaysians | 100.0 /100 | #22 | Exceptional 29.8% |
| Mexican American Indians | 100.0 /100 | #23 | Exceptional 29.7% |
| Guamanians/Chamorros | 100.0 /100 | #24 | Exceptional 29.7% |
| Immigrants | Latin America | 100.0 /100 | #25 | Exceptional 29.7% |
Demographics Similar to Indians (Asian) by Family Households with Children
In terms of family households with children, the demographic groups most similar to Indians (Asian) are Romanian (27.6%, a difference of 0.020%), Mongolian (27.6%, a difference of 0.020%), Hungarian (27.6%, a difference of 0.080%), Comanche (27.6%, a difference of 0.090%), and Icelander (27.6%, a difference of 0.10%).
| Demographics | Rating | Rank | Family Households with Children |
| Argentineans | 78.5 /100 | #150 | Good 27.6% |
| Portuguese | 77.8 /100 | #151 | Good 27.6% |
| Ethiopians | 77.0 /100 | #152 | Good 27.6% |
| Immigrants | Cabo Verde | 75.6 /100 | #153 | Good 27.6% |
| Icelanders | 75.3 /100 | #154 | Good 27.6% |
| Comanche | 74.8 /100 | #155 | Good 27.6% |
| Hungarians | 74.6 /100 | #156 | Good 27.6% |
| Indians (Asian) | 71.6 /100 | #157 | Good 27.6% |
| Romanians | 70.8 /100 | #158 | Good 27.6% |
| Mongolians | 70.7 /100 | #159 | Good 27.6% |
| Sub-Saharan Africans | 67.5 /100 | #160 | Good 27.6% |
| Alaskan Athabascans | 67.1 /100 | #161 | Good 27.6% |
| Immigrants | Bangladesh | 67.0 /100 | #162 | Good 27.6% |
| Czechs | 65.3 /100 | #163 | Good 27.5% |
| Immigrants | Hong Kong | 64.9 /100 | #164 | Good 27.5% |