Panamanian vs West Indian Family Households
COMPARE
Panamanian
West Indian
Family Households
Family Households Comparison
Panamanians
West Indians
64.8%
FAMILY HOUSEHOLDS
92.4/ 100
METRIC RATING
126th/ 347
METRIC RANK
63.1%
FAMILY HOUSEHOLDS
0.3/ 100
METRIC RATING
275th/ 347
METRIC RANK
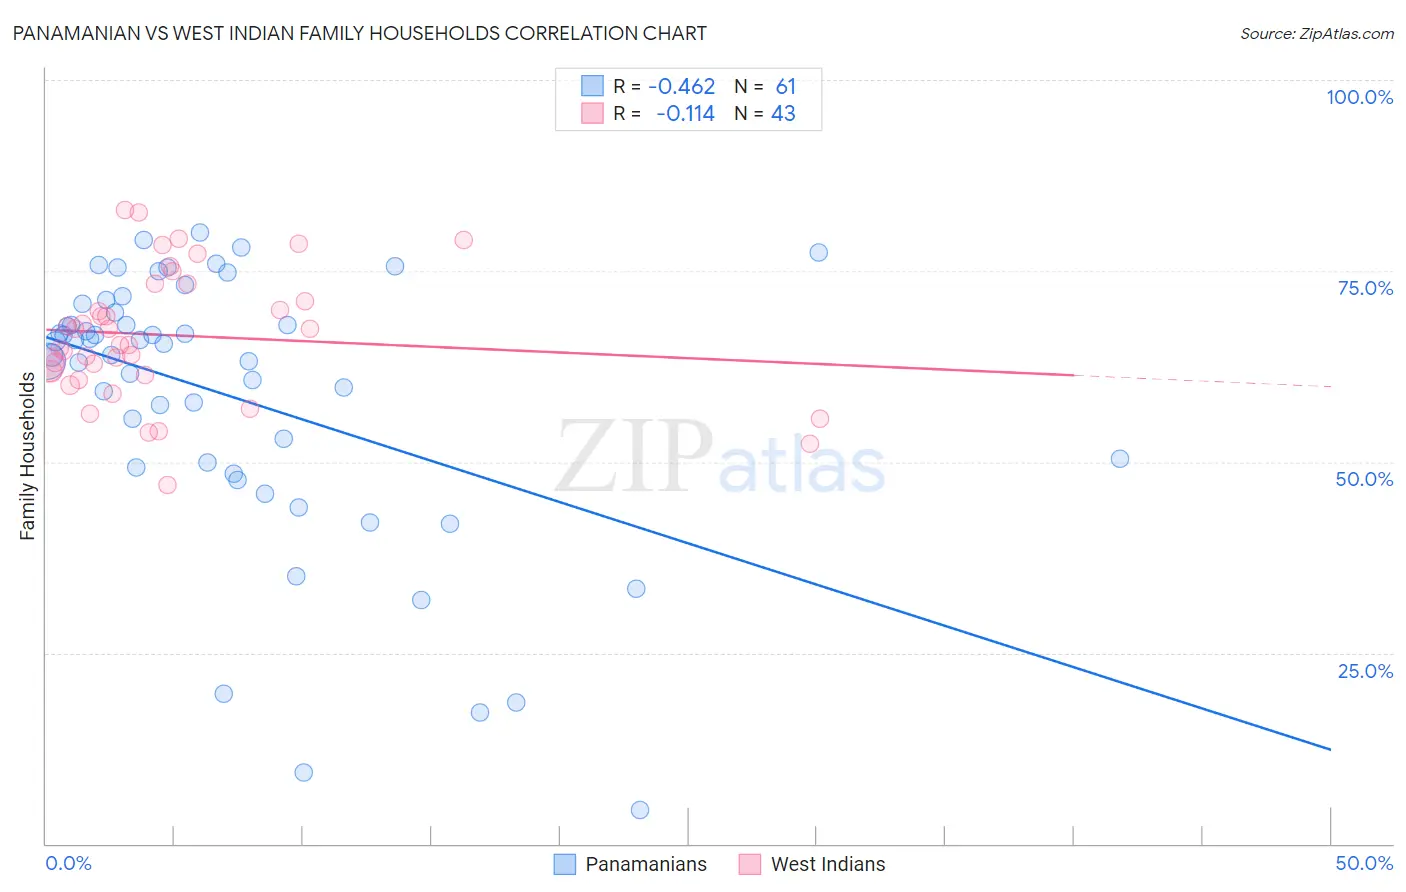
Panamanian vs West Indian Family Households Correlation Chart
The statistical analysis conducted on geographies consisting of 281,073,089 people shows a moderate negative correlation between the proportion of Panamanians and percentage of family households in the United States with a correlation coefficient (R) of -0.462 and weighted average of 64.8%. Similarly, the statistical analysis conducted on geographies consisting of 253,859,677 people shows a poor negative correlation between the proportion of West Indians and percentage of family households in the United States with a correlation coefficient (R) of -0.114 and weighted average of 63.1%, a difference of 2.8%.
Family Households Correlation Summary
| Measurement | Panamanian | West Indian |
| Minimum | 4.4% | 47.0% |
| Maximum | 80.0% | 83.0% |
| Range | 75.6% | 36.0% |
| Mean | 58.6% | 66.5% |
| Median | 65.5% | 65.3% |
| Interquartile 25% (IQ1) | 49.5% | 61.3% |
| Interquartile 75% (IQ3) | 70.1% | 73.3% |
| Interquartile Range (IQR) | 20.6% | 12.0% |
| Standard Deviation (Sample) | 17.8% | 8.5% |
| Standard Deviation (Population) | 17.7% | 8.4% |
Similar Demographics by Family Households
Demographics Similar to Panamanians by Family Households
In terms of family households, the demographic groups most similar to Panamanians are Immigrants from Argentina (64.9%, a difference of 0.020%), Immigrants from Belize (64.9%, a difference of 0.020%), Immigrants from Panama (64.8%, a difference of 0.020%), Italian (64.8%, a difference of 0.020%), and Hmong (64.9%, a difference of 0.050%).
| Demographics | Rating | Rank | Family Households |
| Immigrants | Eastern Asia | 94.4 /100 | #119 | Exceptional 64.9% |
| Immigrants | Oceania | 94.2 /100 | #120 | Exceptional 64.9% |
| Hungarians | 94.0 /100 | #121 | Exceptional 64.9% |
| Hmong | 93.4 /100 | #122 | Exceptional 64.9% |
| Choctaw | 93.4 /100 | #123 | Exceptional 64.9% |
| Immigrants | Argentina | 92.8 /100 | #124 | Exceptional 64.9% |
| Immigrants | Belize | 92.7 /100 | #125 | Exceptional 64.9% |
| Panamanians | 92.4 /100 | #126 | Exceptional 64.8% |
| Immigrants | Panama | 92.0 /100 | #127 | Exceptional 64.8% |
| Italians | 91.9 /100 | #128 | Exceptional 64.8% |
| Immigrants | Ecuador | 91.4 /100 | #129 | Exceptional 64.8% |
| Immigrants | Italy | 90.2 /100 | #130 | Exceptional 64.8% |
| Immigrants | Nonimmigrants | 90.1 /100 | #131 | Exceptional 64.8% |
| Cajuns | 89.4 /100 | #132 | Excellent 64.8% |
| Belizeans | 89.3 /100 | #133 | Excellent 64.8% |
Demographics Similar to West Indians by Family Households
In terms of family households, the demographic groups most similar to West Indians are Lumbee (63.1%, a difference of 0.0%), Immigrants from Kazakhstan (63.1%, a difference of 0.010%), Serbian (63.0%, a difference of 0.010%), Immigrants from Croatia (63.1%, a difference of 0.020%), and Immigrants from Turkey (63.1%, a difference of 0.020%).
| Demographics | Rating | Rank | Family Households |
| Immigrants | Singapore | 0.4 /100 | #268 | Tragic 63.1% |
| Yugoslavians | 0.4 /100 | #269 | Tragic 63.1% |
| Immigrants | Austria | 0.3 /100 | #270 | Tragic 63.1% |
| Immigrants | Croatia | 0.3 /100 | #271 | Tragic 63.1% |
| Immigrants | Turkey | 0.3 /100 | #272 | Tragic 63.1% |
| Immigrants | Kazakhstan | 0.3 /100 | #273 | Tragic 63.1% |
| Lumbee | 0.3 /100 | #274 | Tragic 63.1% |
| West Indians | 0.3 /100 | #275 | Tragic 63.1% |
| Serbians | 0.3 /100 | #276 | Tragic 63.0% |
| Ottawa | 0.3 /100 | #277 | Tragic 63.0% |
| Immigrants | Belgium | 0.2 /100 | #278 | Tragic 63.0% |
| Immigrants | Yemen | 0.2 /100 | #279 | Tragic 63.0% |
| Immigrants | Bulgaria | 0.2 /100 | #280 | Tragic 63.0% |
| Estonians | 0.2 /100 | #281 | Tragic 62.9% |
| New Zealanders | 0.1 /100 | #282 | Tragic 62.9% |