Panamanian vs Immigrants from Japan Single Father Households
COMPARE
Panamanian
Immigrants from Japan
Single Father Households
Single Father Households Comparison
Panamanians
Immigrants from Japan
2.4%
SINGLE FATHER HOUSEHOLDS
29.6/ 100
METRIC RATING
194th/ 347
METRIC RANK
2.0%
SINGLE FATHER HOUSEHOLDS
100.0/ 100
METRIC RATING
28th/ 347
METRIC RANK
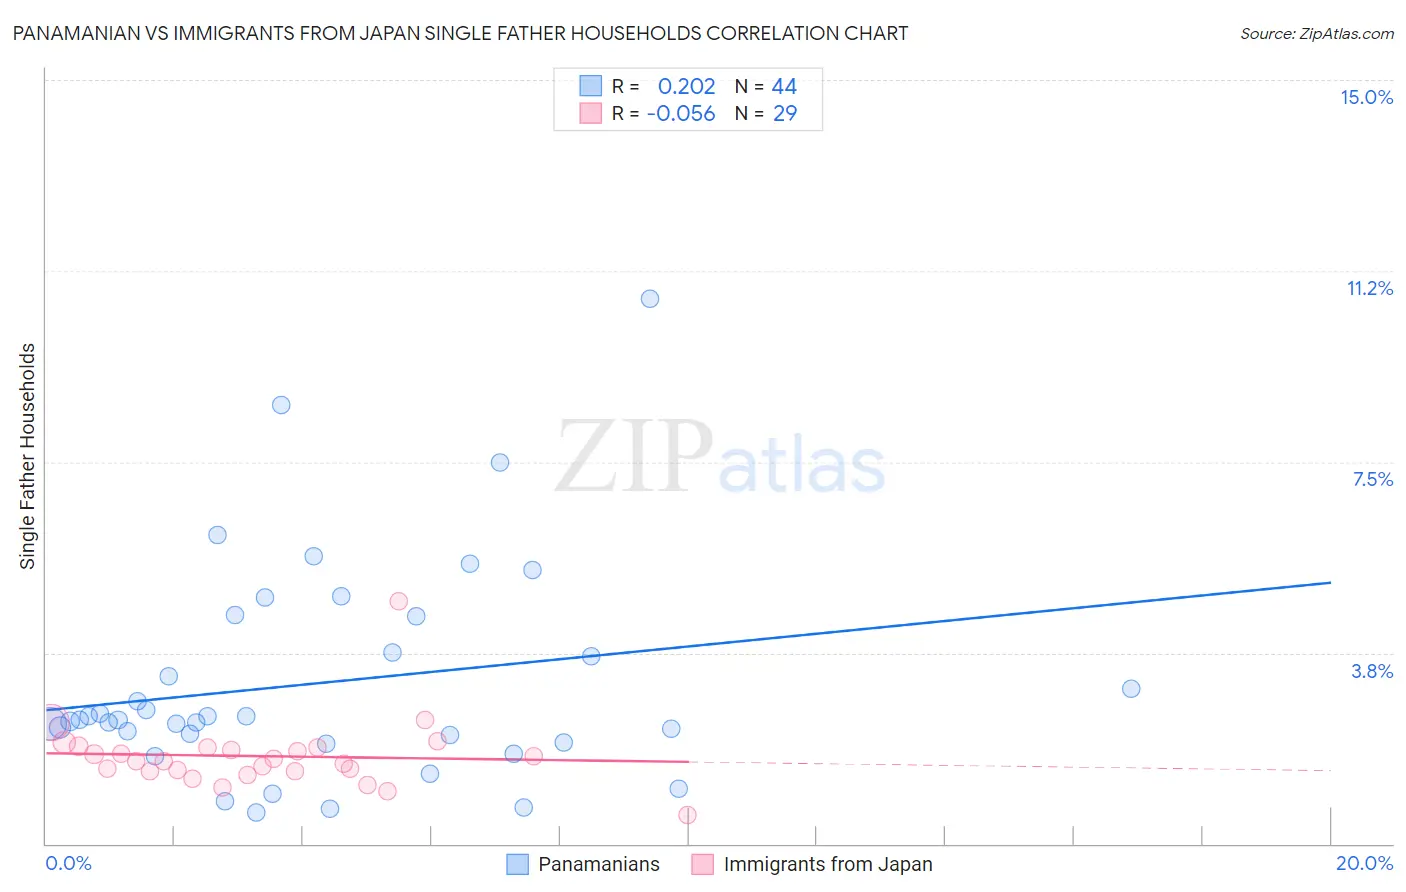
Panamanian vs Immigrants from Japan Single Father Households Correlation Chart
The statistical analysis conducted on geographies consisting of 279,967,091 people shows a weak positive correlation between the proportion of Panamanians and percentage of single father households in the United States with a correlation coefficient (R) of 0.202 and weighted average of 2.4%. Similarly, the statistical analysis conducted on geographies consisting of 337,808,657 people shows a slight negative correlation between the proportion of Immigrants from Japan and percentage of single father households in the United States with a correlation coefficient (R) of -0.056 and weighted average of 2.0%, a difference of 20.6%.
Single Father Households Correlation Summary
| Measurement | Panamanian | Immigrants from Japan |
| Minimum | 0.62% | 0.57% |
| Maximum | 10.7% | 4.8% |
| Range | 10.1% | 4.2% |
| Mean | 3.2% | 1.7% |
| Median | 2.4% | 1.6% |
| Interquartile 25% (IQ1) | 2.1% | 1.4% |
| Interquartile 75% (IQ3) | 4.1% | 1.9% |
| Interquartile Range (IQR) | 2.1% | 0.46% |
| Standard Deviation (Sample) | 2.1% | 0.70% |
| Standard Deviation (Population) | 2.1% | 0.69% |
Similar Demographics by Single Father Households
Demographics Similar to Panamanians by Single Father Households
In terms of single father households, the demographic groups most similar to Panamanians are Uruguayan (2.4%, a difference of 0.010%), Immigrants from Sudan (2.4%, a difference of 0.020%), Immigrants from Africa (2.4%, a difference of 0.030%), Immigrants from Philippines (2.4%, a difference of 0.080%), and Kenyan (2.4%, a difference of 0.14%).
| Demographics | Rating | Rank | Single Father Households |
| Immigrants | Colombia | 34.0 /100 | #187 | Fair 2.4% |
| Hmong | 33.0 /100 | #188 | Fair 2.4% |
| U.S. Virgin Islanders | 31.8 /100 | #189 | Fair 2.4% |
| French | 31.7 /100 | #190 | Fair 2.4% |
| Immigrants | Africa | 30.0 /100 | #191 | Fair 2.4% |
| Immigrants | Sudan | 29.8 /100 | #192 | Fair 2.4% |
| Uruguayans | 29.7 /100 | #193 | Fair 2.4% |
| Panamanians | 29.6 /100 | #194 | Fair 2.4% |
| Immigrants | Philippines | 28.7 /100 | #195 | Fair 2.4% |
| Kenyans | 28.0 /100 | #196 | Fair 2.4% |
| Germans | 28.0 /100 | #197 | Fair 2.4% |
| Scandinavians | 27.4 /100 | #198 | Fair 2.4% |
| Immigrants | Vietnam | 27.1 /100 | #199 | Fair 2.4% |
| Peruvians | 27.1 /100 | #200 | Fair 2.4% |
| Immigrants | Uganda | 26.0 /100 | #201 | Fair 2.4% |
Demographics Similar to Immigrants from Japan by Single Father Households
In terms of single father households, the demographic groups most similar to Immigrants from Japan are Bulgarian (2.0%, a difference of 0.090%), Cambodian (2.0%, a difference of 0.11%), Israeli (2.0%, a difference of 0.14%), Immigrants from South Central Asia (2.0%, a difference of 0.18%), and Chinese (2.0%, a difference of 0.18%).
| Demographics | Rating | Rank | Single Father Households |
| Immigrants | Albania | 100.0 /100 | #21 | Exceptional 1.9% |
| Immigrants | Latvia | 100.0 /100 | #22 | Exceptional 1.9% |
| Immigrants | Croatia | 100.0 /100 | #23 | Exceptional 2.0% |
| Immigrants | Russia | 100.0 /100 | #24 | Exceptional 2.0% |
| Eastern Europeans | 100.0 /100 | #25 | Exceptional 2.0% |
| Assyrians/Chaldeans/Syriacs | 100.0 /100 | #26 | Exceptional 2.0% |
| Immigrants | South Central Asia | 100.0 /100 | #27 | Exceptional 2.0% |
| Immigrants | Japan | 100.0 /100 | #28 | Exceptional 2.0% |
| Bulgarians | 100.0 /100 | #29 | Exceptional 2.0% |
| Cambodians | 100.0 /100 | #30 | Exceptional 2.0% |
| Israelis | 100.0 /100 | #31 | Exceptional 2.0% |
| Chinese | 100.0 /100 | #32 | Exceptional 2.0% |
| Turks | 100.0 /100 | #33 | Exceptional 2.0% |
| Immigrants | Australia | 100.0 /100 | #34 | Exceptional 2.0% |
| Albanians | 100.0 /100 | #35 | Exceptional 2.0% |