Panamanian vs Greek Single Father Households

COMPARE

Panamanian
Race
Ancestry
AfghanAfricanAlaska NativeAlaskan AthabascanAlbanianAleutAlsatianAmericanApacheArabArapahoArgentineanArmenianAssyrian/Chaldean/SyriacAustralianAustrianBahamianBangladeshiBarbadianBasqueBelgianBelizeanBermudanBhutaneseBlackfeetBolivianBrazilianBritishBritish West IndianBulgarianBurmeseCajunCambodianCanadianCape VerdeanCarpatho RusynCelticCentral AmericanCentral American IndianCherokeeCheyenneChickasawChileanChineseChippewaChoctawColombianColvilleComancheCosta RicanCreeCreekCroatianCrowCubanCypriotCzechCzechoslovakianDanishDelawareDominicanDutchDutch West IndianEastern EuropeanEcuadorianEgyptianEnglishEstonianEthiopianEuropeanFijianFilipinoFinnishFrenchFrench American IndianFrench CanadianGermanGerman RussianGhanaianGuamanian/ChamorroGuatemalanGuyaneseHaitianHmongHonduranHopiHoumaHungarianIcelanderIndian (Asian)IndonesianInupiatIranianIraqiIrishIroquoisIsraeliItalianJamaicanJapaneseJordanianKenyanKiowaKoreanLaotianLatvianLebaneseLiberianLithuanianLumbeeLuxembourgerMacedonianMalaysianMalteseMarshalleseMenomineeMexicanMexican American IndianMongolianMoroccanNative HawaiianNavajoNepaleseNew ZealanderNicaraguanNigerianNorthern EuropeanNorwegianOkinawanOsageOttawaPaiutePakistaniPalestinianPanamanianParaguayanPennsylvania GermanPeruvianPimaPolishPortuguesePotawatomiPuebloPuerto RicanPuget Sound SalishRomanianRussianSalvadoranSamoanScandinavianScotch-IrishScottishSeminoleSenegaleseSerbianShoshoneSierra LeoneanSiouxSlavicSlovakSloveneSomaliSouth AfricanSouth AmericanSouth American IndianSoviet UnionSpaniardSpanishSpanish AmericanSpanish American IndianSri LankanSubsaharan AfricanSudaneseSwedishSwissSyrianTaiwaneseThaiTlingit-HaidaTohono O'OdhamTonganTrinidadian and TobagonianTsimshianTurkishU.S. Virgin IslanderUgandanUkrainianUruguayanUteVenezuelanVietnameseWelshWest IndianYakamaYaquiYugoslavianYumanYup'ikZimbabwean
Immigration
NonimmigrantsImmigrantsAfghanistanAfricaAlbaniaArgentinaArmeniaAsiaAustraliaAustriaBahamasBangladeshBarbadosBelarusBelgiumBelizeBoliviaBosnia and HerzegovinaBrazilBulgariaBurma/MyanmarCabo VerdeCambodiaCameroonCanadaCaribbeanCentral AmericaChileChinaColombiaCongoCosta RicaCroatiaCubaCzechoslovakiaDenmarkDominicaDominican RepublicEastern AfricaEastern AsiaEastern EuropeEcuadorEgyptEl SalvadorEnglandEritreaEthiopiaEuropeFijiFranceGermanyGhanaGreeceGrenadaGuatemalaGuyanaHaitiHondurasHong KongHungaryIndiaIndonesiaIranIraqIrelandIsraelItalyJamaicaJapanJordanKazakhstanKenyaKoreaKuwaitLaosLatin AmericaLatviaLebanonLiberiaLithuaniaMalaysiaMexicoMicronesiaMiddle AfricaMoldovaMoroccoNepalNetherlandsNicaraguaNigeriaNorth AmericaNorth MacedoniaNorthern AfricaNorthern EuropeNorwayOceaniaPakistanPanamaPeruPhilippinesPolandPortugalRomaniaRussiaSaudi ArabiaScotlandSenegalSerbiaSierra LeoneSingaporeSomaliaSouth AfricaSouth AmericaSouth Central AsiaSouth Eastern AsiaSouthern EuropeSpainSri LankaSt. Vincent and the GrenadinesSudanSwedenSwitzerlandSyriaTaiwanThailandTrinidad and TobagoTurkeyUgandaUkraineUruguayUzbekistanVenezuelaVietnamWest IndiesWestern AfricaWestern AsiaWestern EuropeYemenZaireZimbabweAzores
Greek
Race
Ancestry
AfghanAfricanAlaska NativeAlaskan AthabascanAlbanianAleutAlsatianAmericanApacheArabArapahoArgentineanArmenianAssyrian/Chaldean/SyriacAustralianAustrianBahamianBangladeshiBarbadianBasqueBelgianBelizeanBermudanBhutaneseBlackfeetBolivianBrazilianBritishBritish West IndianBulgarianBurmeseCajunCambodianCanadianCape VerdeanCarpatho RusynCelticCentral AmericanCentral American IndianCherokeeCheyenneChickasawChileanChineseChippewaChoctawColombianColvilleComancheCosta RicanCreeCreekCroatianCrowCubanCypriotCzechCzechoslovakianDanishDelawareDominicanDutchDutch West IndianEastern EuropeanEcuadorianEgyptianEnglishEstonianEthiopianEuropeanFijianFilipinoFinnishFrenchFrench American IndianFrench CanadianGermanGerman RussianGhanaianGreekGuamanian/ChamorroGuatemalanGuyaneseHaitianHmongHonduranHopiHoumaHungarianIcelanderIndian (Asian)IndonesianInupiatIranianIraqiIrishIroquoisIsraeliItalianJamaicanJapaneseJordanianKenyanKiowaKoreanLaotianLatvianLebaneseLiberianLithuanianLumbeeLuxembourgerMacedonianMalaysianMalteseMarshalleseMenomineeMexicanMexican American IndianMongolianMoroccanNative HawaiianNavajoNepaleseNew ZealanderNicaraguanNigerianNorthern EuropeanNorwegianOkinawanOsageOttawaPaiutePakistaniPalestinianParaguayanPennsylvania GermanPeruvianPimaPolishPortuguesePotawatomiPuebloPuerto RicanPuget Sound SalishRomanianRussianSalvadoranSamoanScandinavianScotch-IrishScottishSeminoleSenegaleseSerbianShoshoneSierra LeoneanSiouxSlavicSlovakSloveneSomaliSouth AfricanSouth AmericanSouth American IndianSoviet UnionSpaniardSpanishSpanish AmericanSpanish American IndianSri LankanSubsaharan AfricanSudaneseSwedishSwissSyrianTaiwaneseThaiTlingit-HaidaTohono O'OdhamTonganTrinidadian and TobagonianTsimshianTurkishU.S. Virgin IslanderUgandanUkrainianUruguayanUteVenezuelanVietnameseWelshWest IndianYakamaYaquiYugoslavianYumanYup'ikZimbabwean
Immigration
NonimmigrantsImmigrantsAfghanistanAfricaAlbaniaArgentinaArmeniaAsiaAustraliaAustriaBahamasBangladeshBarbadosBelarusBelgiumBelizeBoliviaBosnia and HerzegovinaBrazilBulgariaBurma/MyanmarCabo VerdeCambodiaCameroonCanadaCaribbeanCentral AmericaChileChinaColombiaCongoCosta RicaCroatiaCubaCzechoslovakiaDenmarkDominicaDominican RepublicEastern AfricaEastern AsiaEastern EuropeEcuadorEgyptEl SalvadorEnglandEritreaEthiopiaEuropeFijiFranceGermanyGhanaGreeceGrenadaGuatemalaGuyanaHaitiHondurasHong KongHungaryIndiaIndonesiaIranIraqIrelandIsraelItalyJamaicaJapanJordanKazakhstanKenyaKoreaKuwaitLaosLatin AmericaLatviaLebanonLiberiaLithuaniaMalaysiaMexicoMicronesiaMiddle AfricaMoldovaMoroccoNepalNetherlandsNicaraguaNigeriaNorth AmericaNorth MacedoniaNorthern AfricaNorthern EuropeNorwayOceaniaPakistanPanamaPeruPhilippinesPolandPortugalRomaniaRussiaSaudi ArabiaScotlandSenegalSerbiaSierra LeoneSingaporeSomaliaSouth AfricaSouth AmericaSouth Central AsiaSouth Eastern AsiaSouthern EuropeSpainSri LankaSt. Vincent and the GrenadinesSudanSwedenSwitzerlandSyriaTaiwanThailandTrinidad and TobagoTurkeyUgandaUkraineUruguayUzbekistanVenezuelaVietnamWest IndiesWestern AfricaWestern AsiaWestern EuropeYemenZaireZimbabweAzores
Single Father Households
Income
Poverty
Unemployment
Labor Participation
Family Structure
Vehicle Availability
Education Level
Disability

Single Father Households Comparison

Panamanians

Greeks

Fair
Exceptional
2.4%
SINGLE FATHER HOUSEHOLDS
29.6/ 100
METRIC RATING
194th/ 347
METRIC RANK
2.1%
SINGLE FATHER HOUSEHOLDS
99.7/ 100
METRIC RATING
83rd/ 347
METRIC RANK

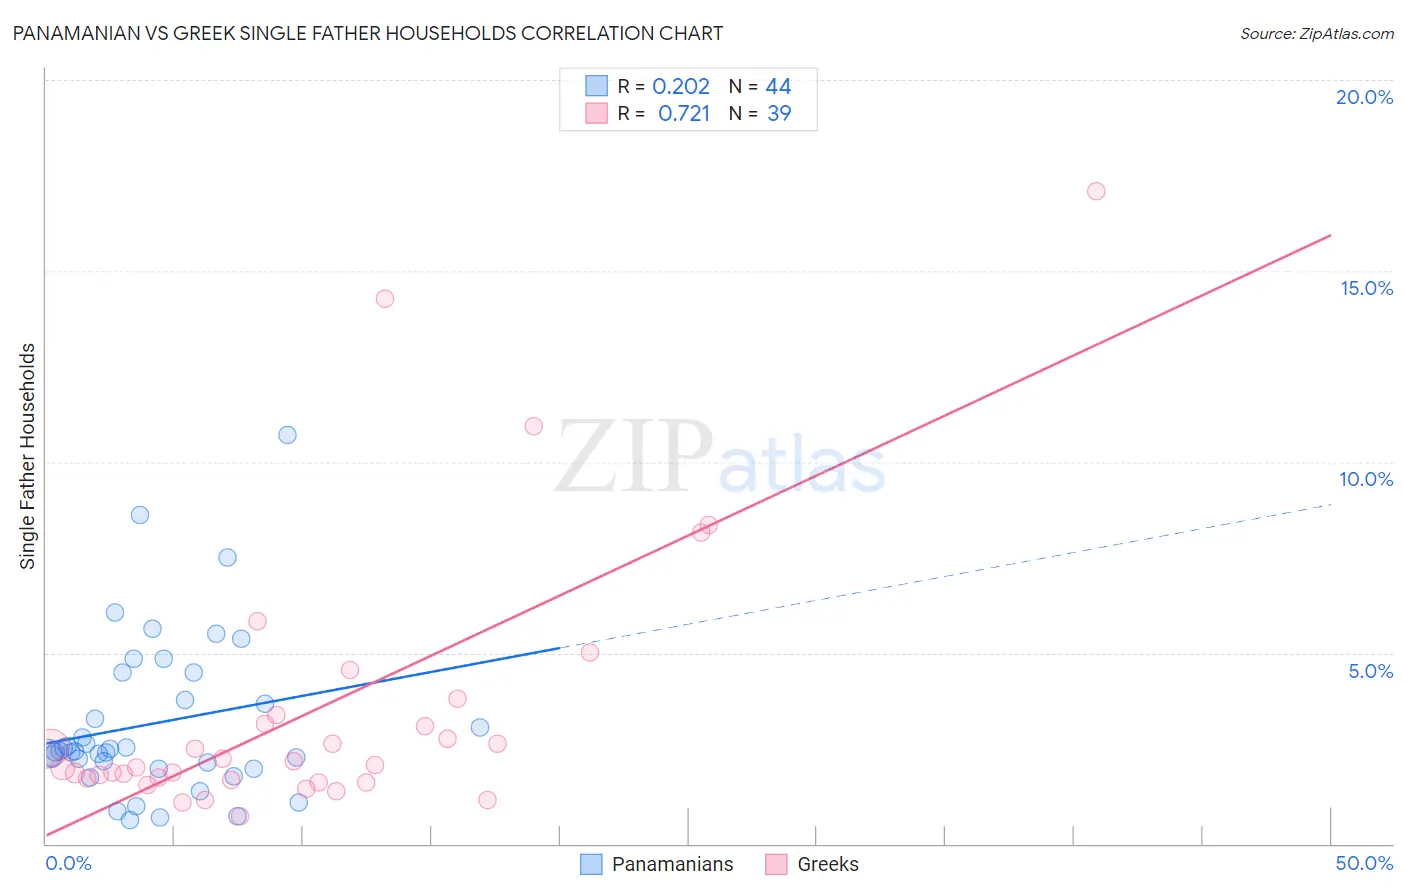
Panamanian vs Greek Single Father Households Correlation Chart

The statistical analysis conducted on geographies consisting of 279,967,091 people shows a weak positive correlation between the proportion of Panamanians and percentage of single father households in the United States with a correlation coefficient (R) of 0.202 and weighted average of 2.4%. Similarly, the statistical analysis conducted on geographies consisting of 475,873,790 people shows a strong positive correlation between the proportion of Greeks and percentage of single father households in the United States with a correlation coefficient (R) of 0.721 and weighted average of 2.1%, a difference of 13.6%.
Panamanian vs Greek Single Father Households

Single Father Households Correlation Summary

MeasurementPanamanianGreek
Minimum0.62%0.73%
Maximum10.7%17.1%
Range10.1%16.3%
Mean3.2%3.5%
Median2.4%2.1%
Interquartile 25% (IQ1)2.1%1.7%
Interquartile 75% (IQ3)4.1%3.4%
Interquartile Range (IQR)2.1%1.7%
Standard Deviation (Sample)2.1%3.6%
Standard Deviation (Population)2.1%3.6%

Similar Demographics by Single Father Households

Demographics Similar to Panamanians by Single Father Households

In terms of single father households, the demographic groups most similar to Panamanians are Uruguayan (2.4%, a difference of 0.010%), Immigrants from Sudan (2.4%, a difference of 0.020%), Immigrants from Africa (2.4%, a difference of 0.030%), Immigrants from Philippines (2.4%, a difference of 0.080%), and Kenyan (2.4%, a difference of 0.14%).
DemographicsRating | RankSingle Father Households
Immigrants | Colombia
34.0
/100
|
#187
Fair
2.4%
Hmong
33.0
/100
|
#188
Fair
2.4%
U.S. Virgin Islanders
31.8
/100
|
#189
Fair
2.4%
French
31.7
/100
|
#190
Fair
2.4%
Immigrants | Africa
30.0
/100
|
#191
Fair
2.4%
Immigrants | Sudan
29.8
/100
|
#192
Fair
2.4%
Uruguayans
29.7
/100
|
#193
Fair
2.4%
Panamanians
29.6
/100
|
#194
Fair
2.4%
Immigrants | Philippines
28.7
/100
|
#195
Fair
2.4%
Kenyans
28.0
/100
|
#196
Fair
2.4%
Germans
28.0
/100
|
#197
Fair
2.4%
Scandinavians
27.4
/100
|
#198
Fair
2.4%
Immigrants | Vietnam
27.1
/100
|
#199
Fair
2.4%
Peruvians
27.1
/100
|
#200
Fair
2.4%
Immigrants | Uganda
26.0
/100
|
#201
Fair
2.4%

Demographics Similar to Greeks by Single Father Households

In terms of single father households, the demographic groups most similar to Greeks are New Zealander (2.1%, a difference of 0.010%), Armenian (2.1%, a difference of 0.060%), Immigrants from South Africa (2.1%, a difference of 0.14%), Immigrants from Asia (2.1%, a difference of 0.23%), and Carpatho Rusyn (2.1%, a difference of 0.30%).
DemographicsRating | RankSingle Father Households
Immigrants | Scotland
99.8
/100
|
#76
Exceptional
2.1%
Immigrants | Saudi Arabia
99.8
/100
|
#77
Exceptional
2.1%
Estonians
99.7
/100
|
#78
Exceptional
2.1%
Immigrants | Asia
99.7
/100
|
#79
Exceptional
2.1%
Immigrants | South Africa
99.7
/100
|
#80
Exceptional
2.1%
Armenians
99.7
/100
|
#81
Exceptional
2.1%
New Zealanders
99.7
/100
|
#82
Exceptional
2.1%
Greeks
99.7
/100
|
#83
Exceptional
2.1%
Carpatho Rusyns
99.6
/100
|
#84
Exceptional
2.1%
Immigrants | Hungary
99.6
/100
|
#85
Exceptional
2.1%
Asians
99.6
/100
|
#86
Exceptional
2.1%
Lithuanians
99.5
/100
|
#87
Exceptional
2.1%
Bhutanese
99.5
/100
|
#88
Exceptional
2.1%
Immigrants | Armenia
99.5
/100
|
#89
Exceptional
2.1%
Immigrants | Pakistan
99.5
/100
|
#90
Exceptional
2.1%