Pakistani vs Carpatho Rusyn Births to Unmarried Women
COMPARE
Pakistani
Carpatho Rusyn
Births to Unmarried Women
Births to Unmarried Women Comparison
Pakistanis
Carpatho Rusyns
30.5%
BIRTHS TO UNMARRIED WOMEN
83.0/ 100
METRIC RATING
141st/ 347
METRIC RANK
30.9%
BIRTHS TO UNMARRIED WOMEN
73.5/ 100
METRIC RATING
156th/ 347
METRIC RANK
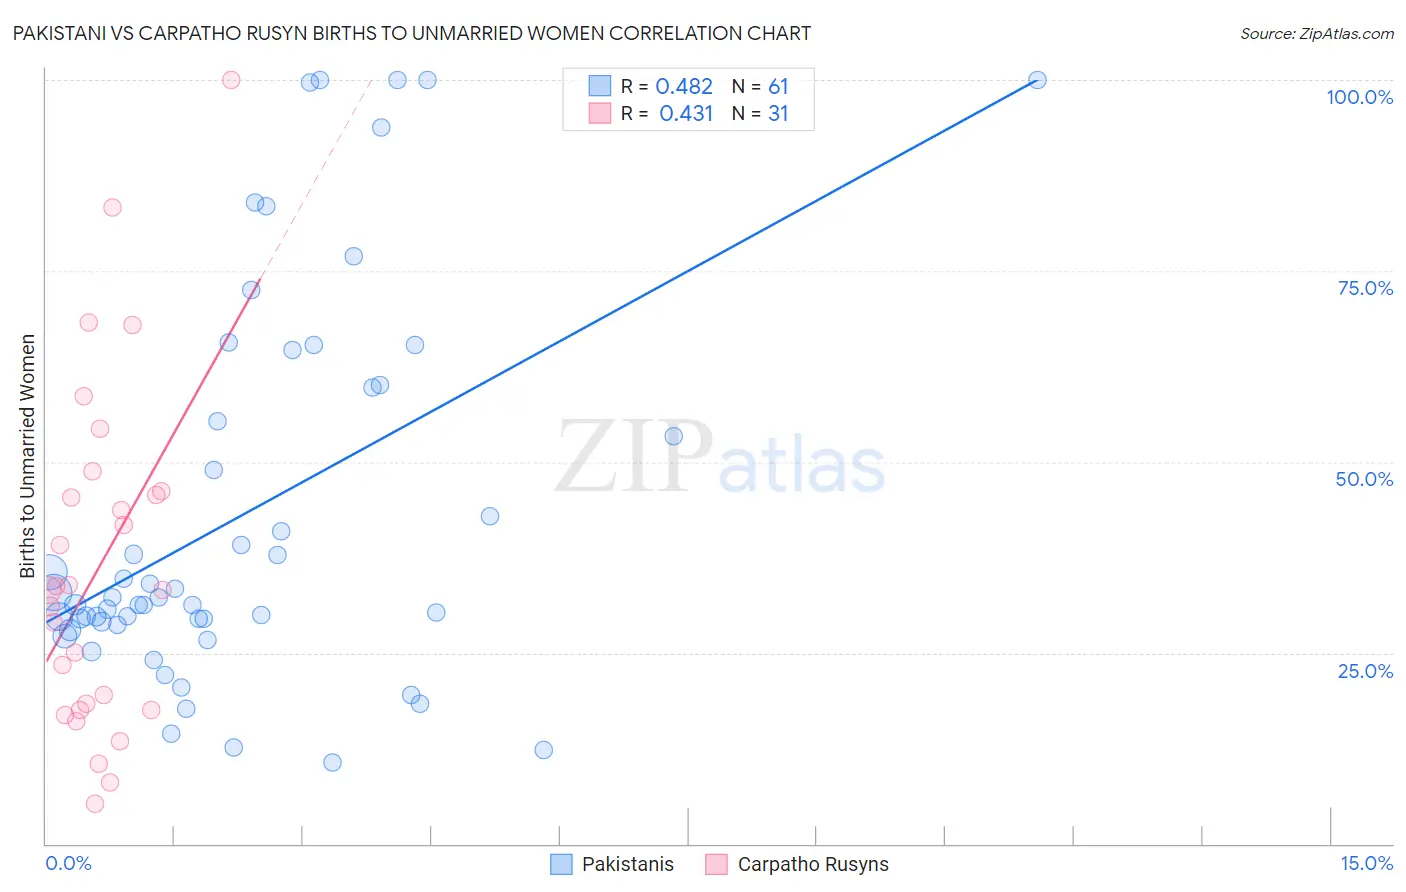
Pakistani vs Carpatho Rusyn Births to Unmarried Women Correlation Chart
The statistical analysis conducted on geographies consisting of 317,371,382 people shows a moderate positive correlation between the proportion of Pakistanis and percentage of births to unmarried women in the United States with a correlation coefficient (R) of 0.482 and weighted average of 30.5%. Similarly, the statistical analysis conducted on geographies consisting of 56,982,210 people shows a moderate positive correlation between the proportion of Carpatho Rusyns and percentage of births to unmarried women in the United States with a correlation coefficient (R) of 0.431 and weighted average of 30.9%, a difference of 1.4%.
Births to Unmarried Women Correlation Summary
| Measurement | Pakistani | Carpatho Rusyn |
| Minimum | 10.7% | 5.2% |
| Maximum | 100.0% | 100.0% |
| Range | 89.3% | 94.8% |
| Mean | 43.3% | 36.4% |
| Median | 32.2% | 33.3% |
| Interquartile 25% (IQ1) | 28.9% | 17.5% |
| Interquartile 75% (IQ3) | 59.8% | 46.2% |
| Interquartile Range (IQR) | 31.0% | 28.7% |
| Standard Deviation (Sample) | 25.2% | 22.4% |
| Standard Deviation (Population) | 25.0% | 22.1% |
Demographics Similar to Pakistanis and Carpatho Rusyns by Births to Unmarried Women
In terms of births to unmarried women, the demographic groups most similar to Pakistanis are Swiss (30.5%, a difference of 0.020%), South African (30.5%, a difference of 0.060%), Immigrants from Uganda (30.5%, a difference of 0.080%), Immigrants from Canada (30.4%, a difference of 0.13%), and Czech (30.5%, a difference of 0.15%). Similarly, the demographic groups most similar to Carpatho Rusyns are Immigrants from Bangladesh (30.9%, a difference of 0.050%), Immigrants from Eastern Africa (31.0%, a difference of 0.17%), Yugoslavian (30.8%, a difference of 0.20%), British (30.8%, a difference of 0.32%), and Polish (30.8%, a difference of 0.34%).
| Demographics | Rating | Rank | Births to Unmarried Women |
| Puget Sound Salish | 83.9 /100 | #138 | Excellent 30.4% |
| Immigrants | Canada | 83.7 /100 | #139 | Excellent 30.4% |
| Swiss | 83.1 /100 | #140 | Excellent 30.5% |
| Pakistanis | 83.0 /100 | #141 | Excellent 30.5% |
| South Africans | 82.7 /100 | #142 | Excellent 30.5% |
| Immigrants | Uganda | 82.6 /100 | #143 | Excellent 30.5% |
| Czechs | 82.1 /100 | #144 | Excellent 30.5% |
| Immigrants | North America | 81.5 /100 | #145 | Excellent 30.6% |
| Northern Europeans | 81.4 /100 | #146 | Excellent 30.6% |
| Immigrants | Oceania | 81.2 /100 | #147 | Excellent 30.6% |
| Chileans | 79.1 /100 | #148 | Good 30.7% |
| Serbians | 78.8 /100 | #149 | Good 30.7% |
| Somalis | 77.8 /100 | #150 | Good 30.7% |
| Italians | 77.0 /100 | #151 | Good 30.8% |
| Poles | 76.2 /100 | #152 | Good 30.8% |
| British | 76.0 /100 | #153 | Good 30.8% |
| Yugoslavians | 75.1 /100 | #154 | Good 30.8% |
| Immigrants | Bangladesh | 73.9 /100 | #155 | Good 30.9% |
| Carpatho Rusyns | 73.5 /100 | #156 | Good 30.9% |
| Immigrants | Eastern Africa | 72.1 /100 | #157 | Good 31.0% |
| Austrians | 69.9 /100 | #158 | Good 31.0% |