Hispanic or Latino vs Carpatho Rusyn Births to Unmarried Women
COMPARE
Hispanic or Latino
Carpatho Rusyn
Births to Unmarried Women
Births to Unmarried Women Comparison
Hispanics or Latinos
Carpatho Rusyns
37.8%
BIRTHS TO UNMARRIED WOMEN
0.0/ 100
METRIC RATING
290th/ 347
METRIC RANK
30.9%
BIRTHS TO UNMARRIED WOMEN
73.5/ 100
METRIC RATING
156th/ 347
METRIC RANK
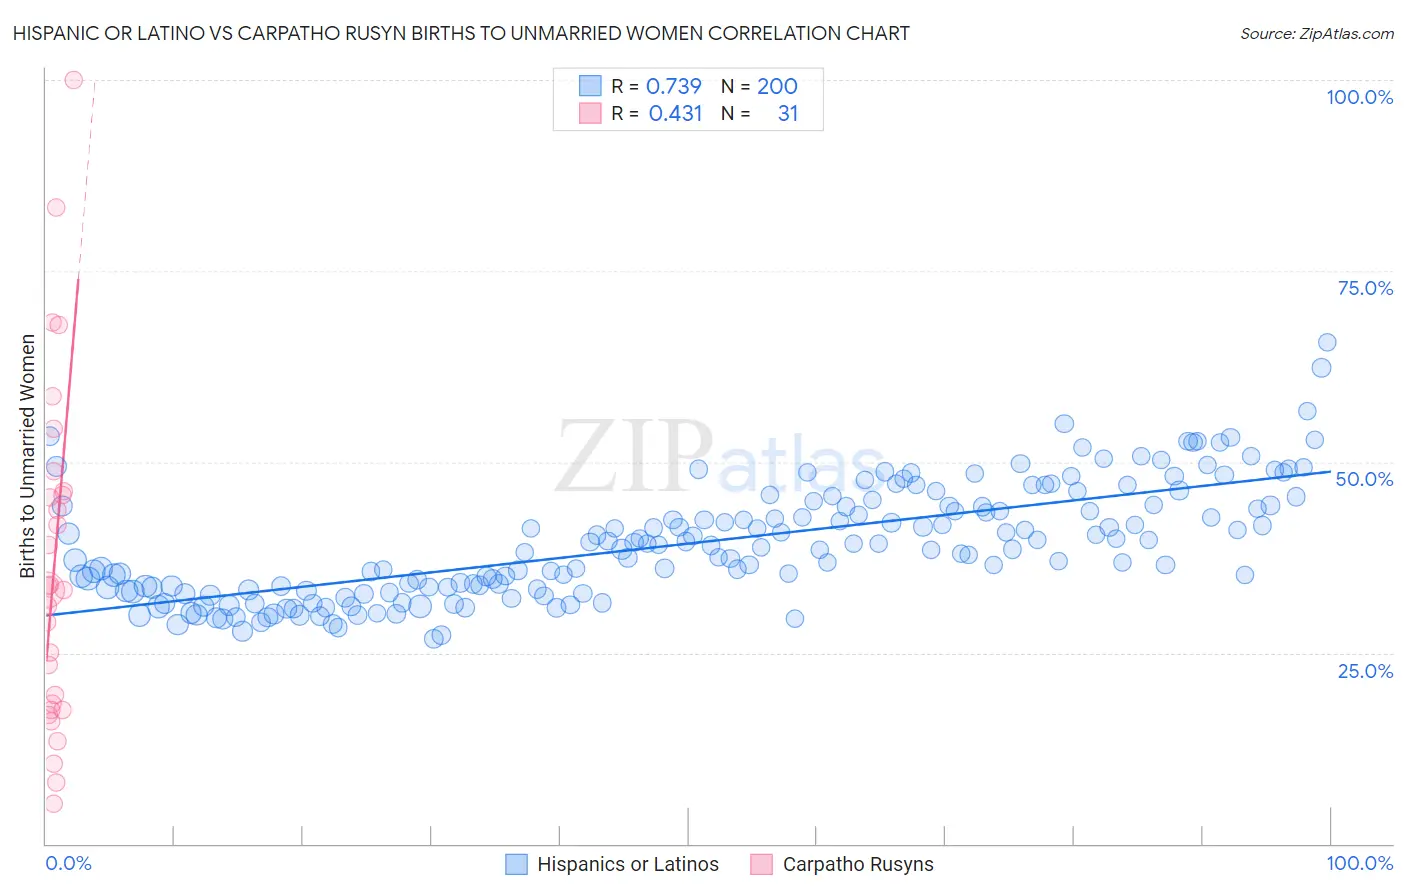
Hispanic or Latino vs Carpatho Rusyn Births to Unmarried Women Correlation Chart
The statistical analysis conducted on geographies consisting of 511,497,668 people shows a strong positive correlation between the proportion of Hispanics or Latinos and percentage of births to unmarried women in the United States with a correlation coefficient (R) of 0.739 and weighted average of 37.8%. Similarly, the statistical analysis conducted on geographies consisting of 56,982,210 people shows a moderate positive correlation between the proportion of Carpatho Rusyns and percentage of births to unmarried women in the United States with a correlation coefficient (R) of 0.431 and weighted average of 30.9%, a difference of 22.2%.
Births to Unmarried Women Correlation Summary
| Measurement | Hispanic or Latino | Carpatho Rusyn |
| Minimum | 26.9% | 5.2% |
| Maximum | 65.6% | 100.0% |
| Range | 38.8% | 94.8% |
| Mean | 39.3% | 36.4% |
| Median | 38.7% | 33.3% |
| Interquartile 25% (IQ1) | 33.3% | 17.5% |
| Interquartile 75% (IQ3) | 44.3% | 46.2% |
| Interquartile Range (IQR) | 11.0% | 28.7% |
| Standard Deviation (Sample) | 7.4% | 22.4% |
| Standard Deviation (Population) | 7.4% | 22.1% |
Similar Demographics by Births to Unmarried Women
Demographics Similar to Hispanics or Latinos by Births to Unmarried Women
In terms of births to unmarried women, the demographic groups most similar to Hispanics or Latinos are Alaskan Athabascan (37.7%, a difference of 0.14%), Seminole (37.9%, a difference of 0.34%), Immigrants from Liberia (37.6%, a difference of 0.37%), Blackfeet (37.9%, a difference of 0.39%), and Creek (37.6%, a difference of 0.54%).
| Demographics | Rating | Rank | Births to Unmarried Women |
| Spanish American Indians | 0.0 /100 | #283 | Tragic 37.4% |
| Immigrants | Central America | 0.0 /100 | #284 | Tragic 37.4% |
| Immigrants | Mexico | 0.0 /100 | #285 | Tragic 37.5% |
| Immigrants | Guatemala | 0.0 /100 | #286 | Tragic 37.5% |
| Creek | 0.0 /100 | #287 | Tragic 37.6% |
| Immigrants | Liberia | 0.0 /100 | #288 | Tragic 37.6% |
| Alaskan Athabascans | 0.0 /100 | #289 | Tragic 37.7% |
| Hispanics or Latinos | 0.0 /100 | #290 | Tragic 37.8% |
| Seminole | 0.0 /100 | #291 | Tragic 37.9% |
| Blackfeet | 0.0 /100 | #292 | Tragic 37.9% |
| Immigrants | Nicaragua | 0.0 /100 | #293 | Tragic 38.0% |
| British West Indians | 0.0 /100 | #294 | Tragic 38.0% |
| Iroquois | 0.0 /100 | #295 | Tragic 38.2% |
| Alaska Natives | 0.0 /100 | #296 | Tragic 38.3% |
| Dutch West Indians | 0.0 /100 | #297 | Tragic 38.4% |
Demographics Similar to Carpatho Rusyns by Births to Unmarried Women
In terms of births to unmarried women, the demographic groups most similar to Carpatho Rusyns are Immigrants from Bangladesh (30.9%, a difference of 0.050%), Immigrants from Eastern Africa (31.0%, a difference of 0.17%), Yugoslavian (30.8%, a difference of 0.20%), British (30.8%, a difference of 0.32%), and Polish (30.8%, a difference of 0.34%).
| Demographics | Rating | Rank | Births to Unmarried Women |
| Serbians | 78.8 /100 | #149 | Good 30.7% |
| Somalis | 77.8 /100 | #150 | Good 30.7% |
| Italians | 77.0 /100 | #151 | Good 30.8% |
| Poles | 76.2 /100 | #152 | Good 30.8% |
| British | 76.0 /100 | #153 | Good 30.8% |
| Yugoslavians | 75.1 /100 | #154 | Good 30.8% |
| Immigrants | Bangladesh | 73.9 /100 | #155 | Good 30.9% |
| Carpatho Rusyns | 73.5 /100 | #156 | Good 30.9% |
| Immigrants | Eastern Africa | 72.1 /100 | #157 | Good 31.0% |
| Austrians | 69.9 /100 | #158 | Good 31.0% |
| Immigrants | England | 69.4 /100 | #159 | Good 31.1% |
| Immigrants | Western Europe | 69.3 /100 | #160 | Good 31.1% |
| Immigrants | Southern Europe | 68.7 /100 | #161 | Good 31.1% |
| Slovenes | 65.9 /100 | #162 | Good 31.2% |
| Immigrants | Chile | 65.7 /100 | #163 | Good 31.2% |