Osage vs Immigrants from Oceania Currently Married
COMPARE
Osage
Immigrants from Oceania
Currently Married
Currently Married Comparison
Osage
Immigrants from Oceania
47.5%
CURRENTLY MARRIED
87.9/ 100
METRIC RATING
122nd/ 347
METRIC RANK
46.5%
CURRENTLY MARRIED
44.6/ 100
METRIC RATING
179th/ 347
METRIC RANK
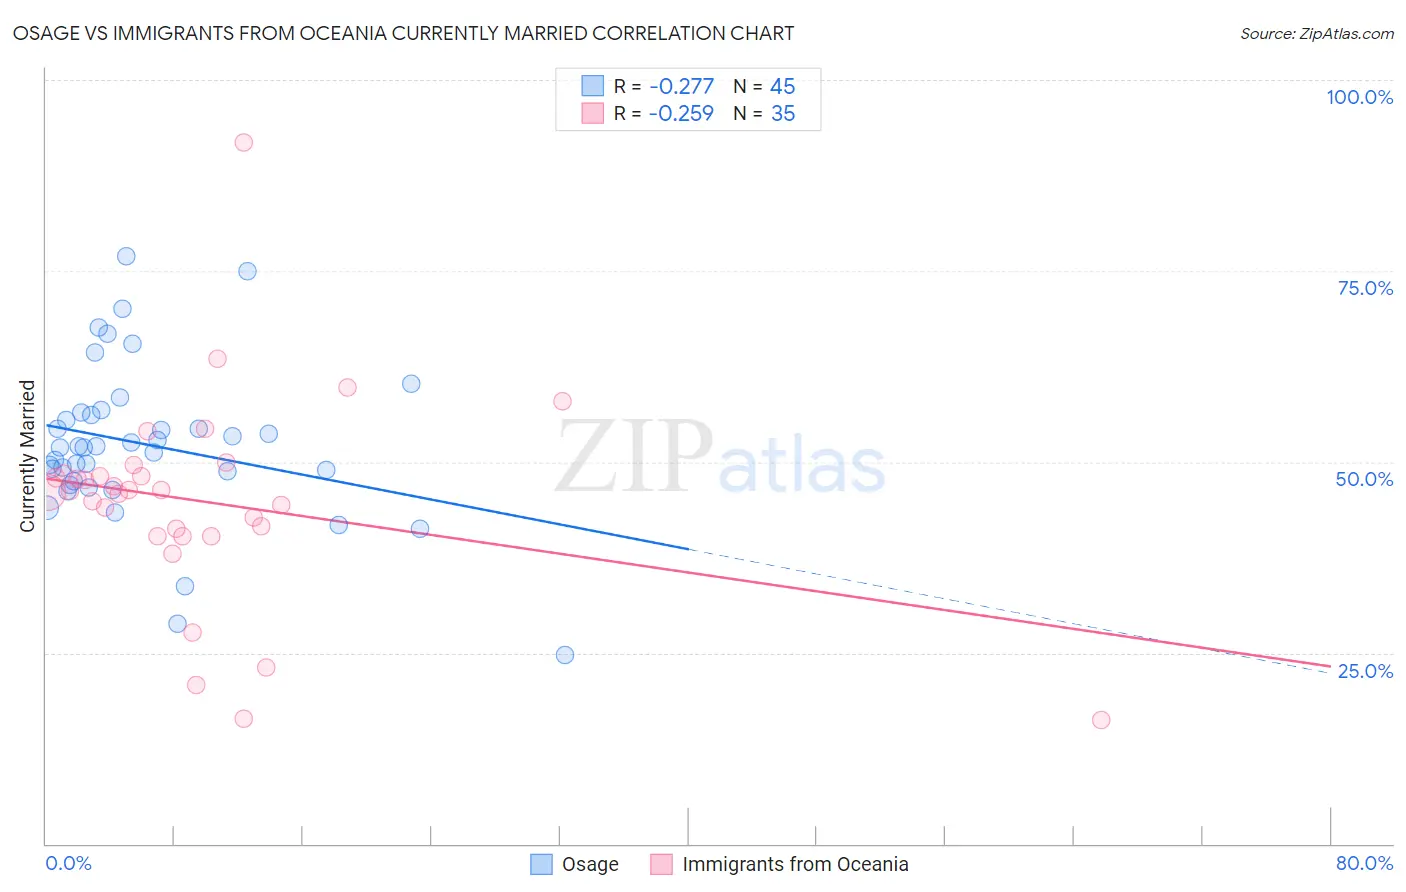
Osage vs Immigrants from Oceania Currently Married Correlation Chart
The statistical analysis conducted on geographies consisting of 91,806,752 people shows a weak negative correlation between the proportion of Osage and percentage of population currently married in the United States with a correlation coefficient (R) of -0.277 and weighted average of 47.5%. Similarly, the statistical analysis conducted on geographies consisting of 305,491,409 people shows a weak negative correlation between the proportion of Immigrants from Oceania and percentage of population currently married in the United States with a correlation coefficient (R) of -0.259 and weighted average of 46.5%, a difference of 2.0%.
Currently Married Correlation Summary
| Measurement | Osage | Immigrants from Oceania |
| Minimum | 24.7% | 16.2% |
| Maximum | 76.9% | 91.9% |
| Range | 52.2% | 75.7% |
| Mean | 52.2% | 44.8% |
| Median | 51.9% | 46.2% |
| Interquartile 25% (IQ1) | 47.2% | 40.3% |
| Interquartile 75% (IQ3) | 56.3% | 48.5% |
| Interquartile Range (IQR) | 9.1% | 8.2% |
| Standard Deviation (Sample) | 10.3% | 13.7% |
| Standard Deviation (Population) | 10.2% | 13.5% |
Similar Demographics by Currently Married
Demographics Similar to Osage by Currently Married
In terms of currently married, the demographic groups most similar to Osage are Immigrants from Croatia (47.5%, a difference of 0.060%), Immigrants from Kazakhstan (47.4%, a difference of 0.060%), Syrian (47.5%, a difference of 0.090%), Laotian (47.4%, a difference of 0.11%), and Okinawan (47.4%, a difference of 0.20%).
| Demographics | Rating | Rank | Currently Married |
| Immigrants | Indonesia | 90.5 /100 | #115 | Exceptional 47.6% |
| Palestinians | 90.4 /100 | #116 | Exceptional 47.6% |
| Puget Sound Salish | 90.3 /100 | #117 | Exceptional 47.6% |
| Immigrants | Philippines | 90.2 /100 | #118 | Exceptional 47.6% |
| Australians | 90.2 /100 | #119 | Exceptional 47.6% |
| Syrians | 88.9 /100 | #120 | Excellent 47.5% |
| Immigrants | Croatia | 88.6 /100 | #121 | Excellent 47.5% |
| Osage | 87.9 /100 | #122 | Excellent 47.5% |
| Immigrants | Kazakhstan | 87.2 /100 | #123 | Excellent 47.4% |
| Laotians | 86.6 /100 | #124 | Excellent 47.4% |
| Okinawans | 85.3 /100 | #125 | Excellent 47.4% |
| Immigrants | Jordan | 84.9 /100 | #126 | Excellent 47.4% |
| New Zealanders | 84.9 /100 | #127 | Excellent 47.4% |
| Portuguese | 84.2 /100 | #128 | Excellent 47.3% |
| Sri Lankans | 83.2 /100 | #129 | Excellent 47.3% |
Demographics Similar to Immigrants from Oceania by Currently Married
In terms of currently married, the demographic groups most similar to Immigrants from Oceania are Costa Rican (46.5%, a difference of 0.030%), Ottawa (46.5%, a difference of 0.060%), Potawatomi (46.5%, a difference of 0.10%), Chickasaw (46.6%, a difference of 0.12%), and Hawaiian (46.6%, a difference of 0.15%).
| Demographics | Rating | Rank | Currently Married |
| Aleuts | 52.0 /100 | #172 | Average 46.7% |
| Tlingit-Haida | 51.2 /100 | #173 | Average 46.7% |
| Peruvians | 50.0 /100 | #174 | Average 46.6% |
| Immigrants | Brazil | 49.9 /100 | #175 | Average 46.6% |
| Hawaiians | 48.6 /100 | #176 | Average 46.6% |
| Israelis | 48.6 /100 | #177 | Average 46.6% |
| Chickasaw | 47.8 /100 | #178 | Average 46.6% |
| Immigrants | Oceania | 44.6 /100 | #179 | Average 46.5% |
| Costa Ricans | 43.7 /100 | #180 | Average 46.5% |
| Ottawa | 43.0 /100 | #181 | Average 46.5% |
| Potawatomi | 41.9 /100 | #182 | Average 46.5% |
| Immigrants | Northern Africa | 39.7 /100 | #183 | Fair 46.5% |
| Brazilians | 39.3 /100 | #184 | Fair 46.4% |
| Mongolians | 37.6 /100 | #185 | Fair 46.4% |
| Immigrants | Chile | 36.8 /100 | #186 | Fair 46.4% |