Norwegian vs Shoshone Family Households
COMPARE
Norwegian
Shoshone
Family Households
Family Households Comparison
Norwegians
Shoshone
63.9%
FAMILY HOUSEHOLDS
13.2/ 100
METRIC RATING
203rd/ 347
METRIC RANK
63.8%
FAMILY HOUSEHOLDS
9.4/ 100
METRIC RATING
211th/ 347
METRIC RANK
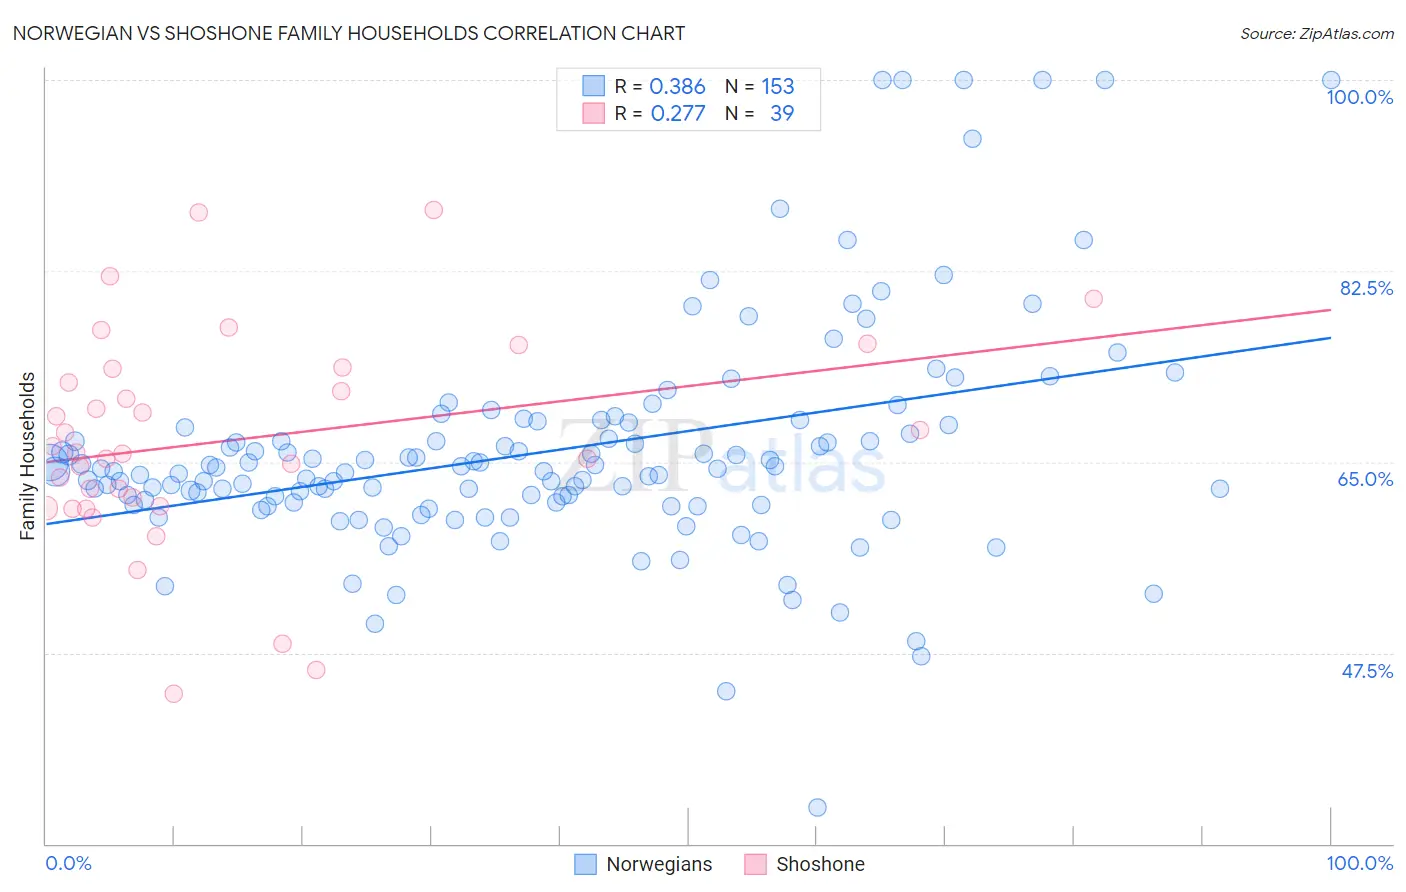
Norwegian vs Shoshone Family Households Correlation Chart
The statistical analysis conducted on geographies consisting of 532,913,401 people shows a mild positive correlation between the proportion of Norwegians and percentage of family households in the United States with a correlation coefficient (R) of 0.386 and weighted average of 63.9%. Similarly, the statistical analysis conducted on geographies consisting of 66,615,877 people shows a weak positive correlation between the proportion of Shoshone and percentage of family households in the United States with a correlation coefficient (R) of 0.277 and weighted average of 63.8%, a difference of 0.13%.
Family Households Correlation Summary
| Measurement | Norwegian | Shoshone |
| Minimum | 33.3% | 43.8% |
| Maximum | 100.0% | 88.1% |
| Range | 66.7% | 44.3% |
| Mean | 66.0% | 67.0% |
| Median | 64.2% | 65.9% |
| Interquartile 25% (IQ1) | 61.1% | 60.9% |
| Interquartile 75% (IQ3) | 68.3% | 73.5% |
| Interquartile Range (IQR) | 7.1% | 12.6% |
| Standard Deviation (Sample) | 10.4% | 9.8% |
| Standard Deviation (Population) | 10.4% | 9.7% |
Demographics Similar to Norwegians and Shoshone by Family Households
In terms of family households, the demographic groups most similar to Norwegians are Iranian (63.9%, a difference of 0.010%), Immigrants from Uruguay (63.9%, a difference of 0.010%), Brazilian (63.9%, a difference of 0.030%), Immigrants from Lithuania (63.9%, a difference of 0.030%), and Nigerian (63.9%, a difference of 0.060%). Similarly, the demographic groups most similar to Shoshone are Immigrants from Netherlands (63.8%, a difference of 0.0%), Immigrants from Thailand (63.8%, a difference of 0.010%), Immigrants from Northern Europe (63.8%, a difference of 0.020%), Celtic (63.8%, a difference of 0.060%), and Nigerian (63.9%, a difference of 0.070%).
| Demographics | Rating | Rank | Family Households |
| Seminole | 18.9 /100 | #197 | Poor 64.0% |
| Poles | 18.9 /100 | #198 | Poor 64.0% |
| Slavs | 18.6 /100 | #199 | Poor 64.0% |
| Immigrants | Malaysia | 17.9 /100 | #200 | Poor 64.0% |
| Immigrants | Eastern Europe | 17.2 /100 | #201 | Poor 64.0% |
| Iranians | 13.5 /100 | #202 | Poor 63.9% |
| Norwegians | 13.2 /100 | #203 | Poor 63.9% |
| Immigrants | Uruguay | 12.8 /100 | #204 | Poor 63.9% |
| Brazilians | 12.4 /100 | #205 | Poor 63.9% |
| Immigrants | Lithuania | 12.1 /100 | #206 | Poor 63.9% |
| Nigerians | 11.5 /100 | #207 | Poor 63.9% |
| Immigrants | Bangladesh | 11.4 /100 | #208 | Poor 63.9% |
| Sierra Leoneans | 11.2 /100 | #209 | Poor 63.9% |
| Immigrants | Thailand | 9.6 /100 | #210 | Tragic 63.8% |
| Shoshone | 9.4 /100 | #211 | Tragic 63.8% |
| Immigrants | Netherlands | 9.4 /100 | #212 | Tragic 63.8% |
| Immigrants | Northern Europe | 8.8 /100 | #213 | Tragic 63.8% |
| Celtics | 8.0 /100 | #214 | Tragic 63.8% |
| Belgians | 7.6 /100 | #215 | Tragic 63.8% |
| Croatians | 7.3 /100 | #216 | Tragic 63.8% |
| Osage | 7.0 /100 | #217 | Tragic 63.7% |