Norwegian vs Colombian Family Households
COMPARE
Norwegian
Colombian
Family Households
Family Households Comparison
Norwegians
Colombians
63.9%
FAMILY HOUSEHOLDS
13.2/ 100
METRIC RATING
203rd/ 347
METRIC RANK
66.3%
FAMILY HOUSEHOLDS
100.0/ 100
METRIC RATING
52nd/ 347
METRIC RANK
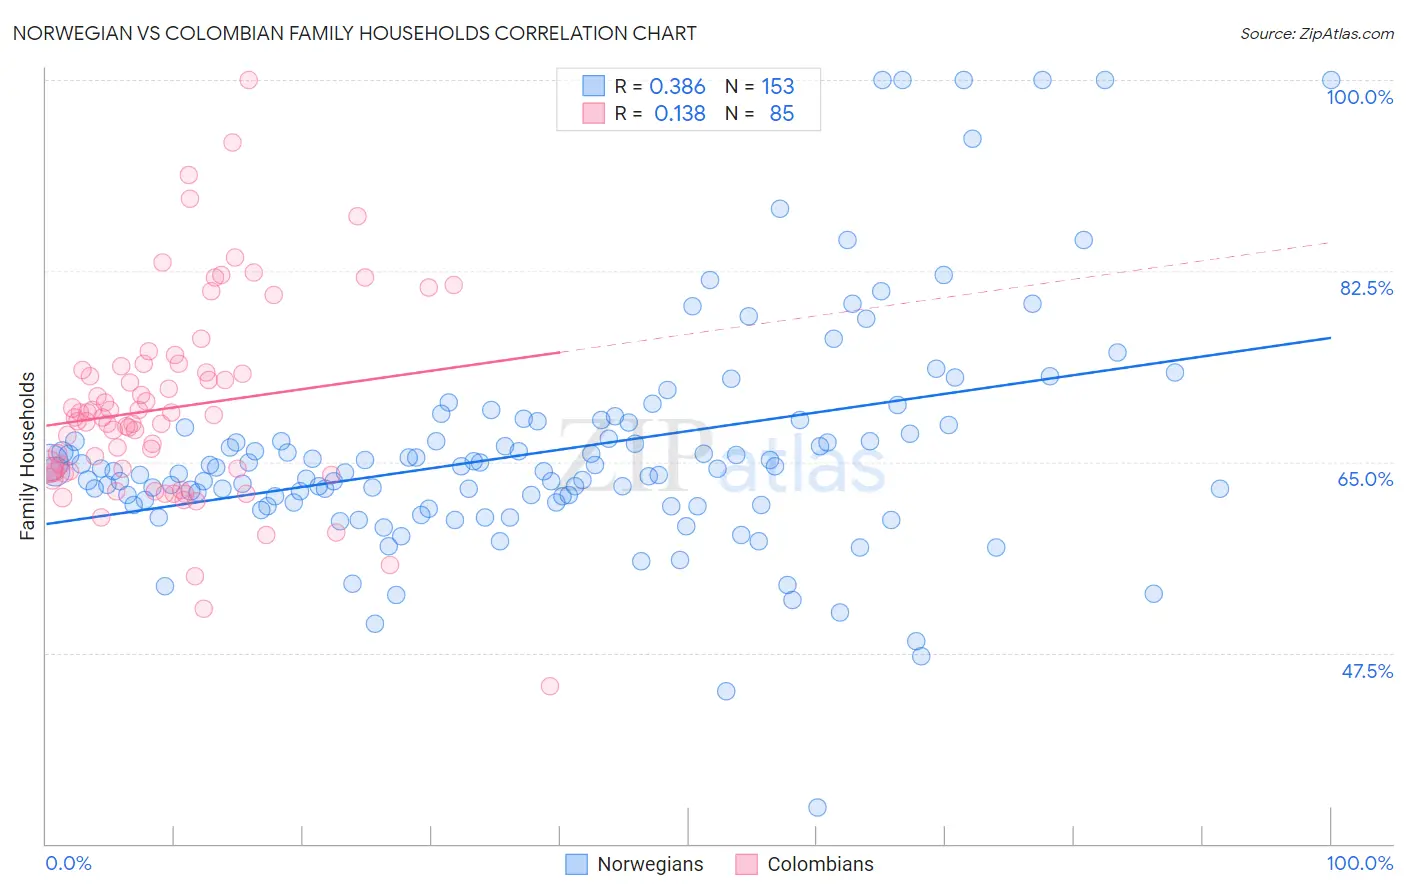
Norwegian vs Colombian Family Households Correlation Chart
The statistical analysis conducted on geographies consisting of 532,913,401 people shows a mild positive correlation between the proportion of Norwegians and percentage of family households in the United States with a correlation coefficient (R) of 0.386 and weighted average of 63.9%. Similarly, the statistical analysis conducted on geographies consisting of 419,324,434 people shows a poor positive correlation between the proportion of Colombians and percentage of family households in the United States with a correlation coefficient (R) of 0.138 and weighted average of 66.3%, a difference of 3.7%.
Family Households Correlation Summary
| Measurement | Norwegian | Colombian |
| Minimum | 33.3% | 44.4% |
| Maximum | 100.0% | 100.0% |
| Range | 66.7% | 55.6% |
| Mean | 66.0% | 70.0% |
| Median | 64.2% | 69.1% |
| Interquartile 25% (IQ1) | 61.1% | 64.1% |
| Interquartile 75% (IQ3) | 68.3% | 73.6% |
| Interquartile Range (IQR) | 7.1% | 9.5% |
| Standard Deviation (Sample) | 10.4% | 9.2% |
| Standard Deviation (Population) | 10.4% | 9.2% |
Similar Demographics by Family Households
Demographics Similar to Norwegians by Family Households
In terms of family households, the demographic groups most similar to Norwegians are Iranian (63.9%, a difference of 0.010%), Immigrants from Uruguay (63.9%, a difference of 0.010%), Brazilian (63.9%, a difference of 0.030%), Immigrants from Lithuania (63.9%, a difference of 0.030%), and Nigerian (63.9%, a difference of 0.060%).
| Demographics | Rating | Rank | Family Households |
| Immigrants | Canada | 19.2 /100 | #196 | Poor 64.0% |
| Seminole | 18.9 /100 | #197 | Poor 64.0% |
| Poles | 18.9 /100 | #198 | Poor 64.0% |
| Slavs | 18.6 /100 | #199 | Poor 64.0% |
| Immigrants | Malaysia | 17.9 /100 | #200 | Poor 64.0% |
| Immigrants | Eastern Europe | 17.2 /100 | #201 | Poor 64.0% |
| Iranians | 13.5 /100 | #202 | Poor 63.9% |
| Norwegians | 13.2 /100 | #203 | Poor 63.9% |
| Immigrants | Uruguay | 12.8 /100 | #204 | Poor 63.9% |
| Brazilians | 12.4 /100 | #205 | Poor 63.9% |
| Immigrants | Lithuania | 12.1 /100 | #206 | Poor 63.9% |
| Nigerians | 11.5 /100 | #207 | Poor 63.9% |
| Immigrants | Bangladesh | 11.4 /100 | #208 | Poor 63.9% |
| Sierra Leoneans | 11.2 /100 | #209 | Poor 63.9% |
| Immigrants | Thailand | 9.6 /100 | #210 | Tragic 63.8% |
Demographics Similar to Colombians by Family Households
In terms of family households, the demographic groups most similar to Colombians are Afghan (66.3%, a difference of 0.010%), Immigrants from Colombia (66.3%, a difference of 0.010%), Native/Alaskan (66.4%, a difference of 0.14%), Navajo (66.4%, a difference of 0.16%), and Immigrants (66.1%, a difference of 0.17%).
| Demographics | Rating | Rank | Family Households |
| Venezuelans | 100.0 /100 | #45 | Exceptional 66.5% |
| Arapaho | 100.0 /100 | #46 | Exceptional 66.5% |
| Bolivians | 100.0 /100 | #47 | Exceptional 66.5% |
| Immigrants | Venezuela | 100.0 /100 | #48 | Exceptional 66.4% |
| Immigrants | South Central Asia | 100.0 /100 | #49 | Exceptional 66.4% |
| Navajo | 100.0 /100 | #50 | Exceptional 66.4% |
| Natives/Alaskans | 100.0 /100 | #51 | Exceptional 66.4% |
| Colombians | 100.0 /100 | #52 | Exceptional 66.3% |
| Afghans | 100.0 /100 | #53 | Exceptional 66.3% |
| Immigrants | Colombia | 100.0 /100 | #54 | Exceptional 66.3% |
| Immigrants | Immigrants | 100.0 /100 | #55 | Exceptional 66.1% |
| Immigrants | Hong Kong | 100.0 /100 | #56 | Exceptional 66.1% |
| Pennsylvania Germans | 100.0 /100 | #57 | Exceptional 66.1% |
| Immigrants | Asia | 100.0 /100 | #58 | Exceptional 66.1% |
| Immigrants | Korea | 100.0 /100 | #59 | Exceptional 66.0% |