Nigerian vs Immigrants from Sweden Average Family Size
COMPARE
Nigerian
Immigrants from Sweden
Average Family Size
Average Family Size Comparison
Nigerians
Immigrants from Sweden
3.29
AVERAGE FAMILY SIZE
98.6/ 100
METRIC RATING
99th/ 347
METRIC RANK
3.14
AVERAGE FAMILY SIZE
0.2/ 100
METRIC RATING
300th/ 347
METRIC RANK
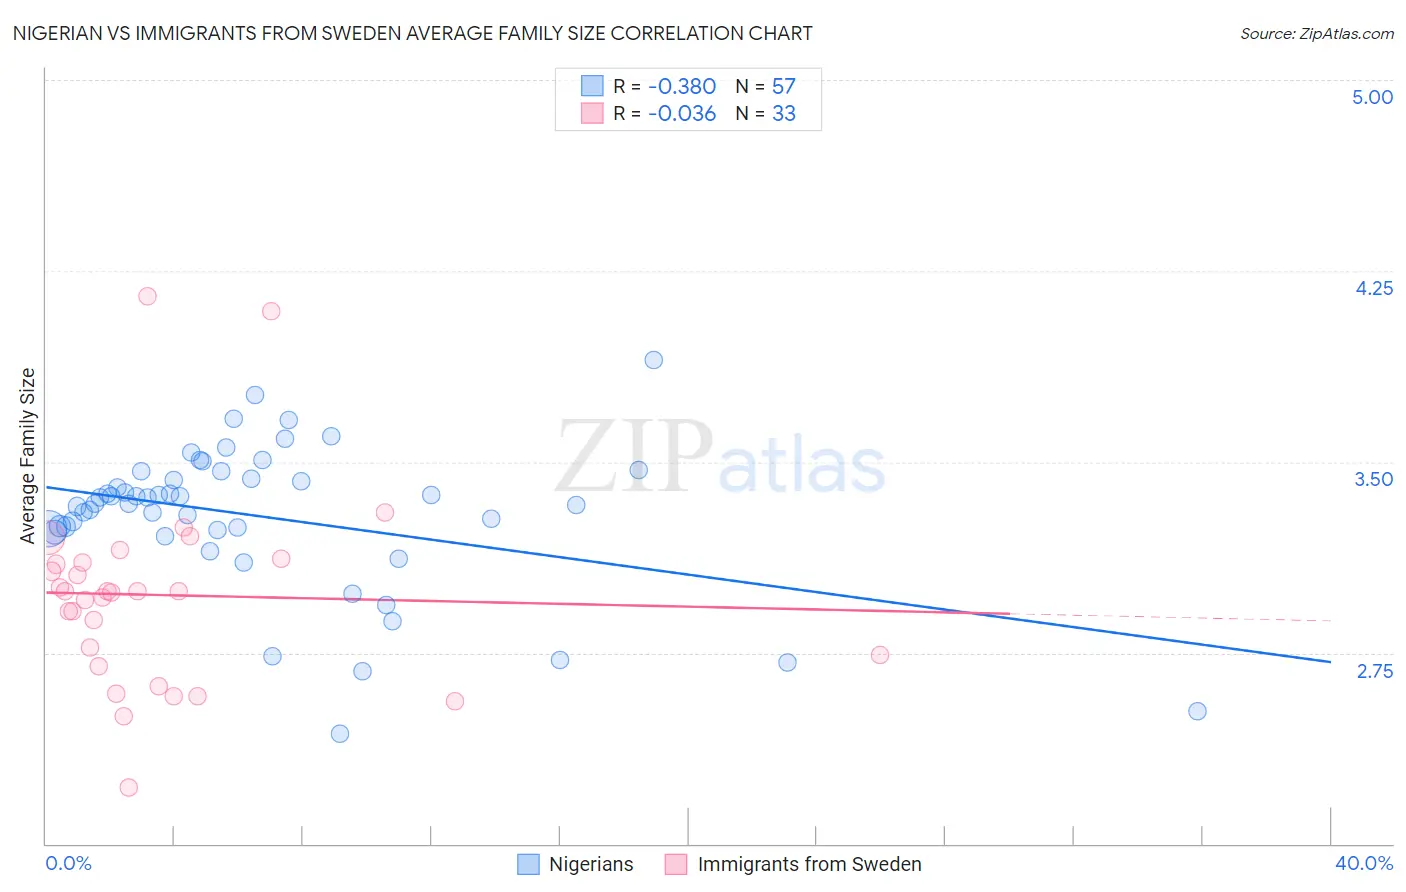
Nigerian vs Immigrants from Sweden Average Family Size Correlation Chart
The statistical analysis conducted on geographies consisting of 332,464,526 people shows a mild negative correlation between the proportion of Nigerians and average family size in the United States with a correlation coefficient (R) of -0.380 and weighted average of 3.29. Similarly, the statistical analysis conducted on geographies consisting of 164,705,218 people shows no correlation between the proportion of Immigrants from Sweden and average family size in the United States with a correlation coefficient (R) of -0.036 and weighted average of 3.14, a difference of 4.9%.
Average Family Size Correlation Summary
| Measurement | Nigerian | Immigrants from Sweden |
| Minimum | 2.43 | 2.22 |
| Maximum | 3.90 | 4.15 |
| Range | 1.47 | 1.93 |
| Mean | 3.28 | 2.98 |
| Median | 3.34 | 2.99 |
| Interquartile 25% (IQ1) | 3.23 | 2.72 |
| Interquartile 75% (IQ3) | 3.45 | 3.11 |
| Interquartile Range (IQR) | 0.22 | 0.39 |
| Standard Deviation (Sample) | 0.29 | 0.39 |
| Standard Deviation (Population) | 0.29 | 0.38 |
Similar Demographics by Average Family Size
Demographics Similar to Nigerians by Average Family Size
In terms of average family size, the demographic groups most similar to Nigerians are Barbadian (3.29, a difference of 0.0%), Immigrants from Oceania (3.29, a difference of 0.010%), Guamanian/Chamorro (3.29, a difference of 0.010%), Immigrants from Burma/Myanmar (3.29, a difference of 0.020%), and West Indian (3.29, a difference of 0.030%).
| Demographics | Rating | Rank | Average Family Size |
| Immigrants | Cameroon | 99.2 /100 | #92 | Exceptional 3.30 |
| Peruvians | 99.2 /100 | #93 | Exceptional 3.30 |
| Sierra Leoneans | 99.0 /100 | #94 | Exceptional 3.30 |
| Immigrants | Lebanon | 99.0 /100 | #95 | Exceptional 3.30 |
| U.S. Virgin Islanders | 98.8 /100 | #96 | Exceptional 3.29 |
| Immigrants | Oceania | 98.7 /100 | #97 | Exceptional 3.29 |
| Barbadians | 98.6 /100 | #98 | Exceptional 3.29 |
| Nigerians | 98.6 /100 | #99 | Exceptional 3.29 |
| Guamanians/Chamorros | 98.6 /100 | #100 | Exceptional 3.29 |
| Immigrants | Burma/Myanmar | 98.6 /100 | #101 | Exceptional 3.29 |
| West Indians | 98.5 /100 | #102 | Exceptional 3.29 |
| Immigrants | Western Africa | 98.4 /100 | #103 | Exceptional 3.29 |
| Bolivians | 98.3 /100 | #104 | Exceptional 3.29 |
| Immigrants | Ghana | 98.1 /100 | #105 | Exceptional 3.29 |
| Paiute | 98.0 /100 | #106 | Exceptional 3.29 |
Demographics Similar to Immigrants from Sweden by Average Family Size
In terms of average family size, the demographic groups most similar to Immigrants from Sweden are Canadian (3.14, a difference of 0.010%), Immigrants from Western Europe (3.14, a difference of 0.060%), Colville (3.14, a difference of 0.060%), Immigrants from Croatia (3.14, a difference of 0.070%), and Austrian (3.14, a difference of 0.070%).
| Demographics | Rating | Rank | Average Family Size |
| Scandinavians | 0.2 /100 | #293 | Tragic 3.14 |
| Immigrants | Croatia | 0.2 /100 | #294 | Tragic 3.14 |
| Austrians | 0.2 /100 | #295 | Tragic 3.14 |
| Ukrainians | 0.2 /100 | #296 | Tragic 3.14 |
| Immigrants | Western Europe | 0.2 /100 | #297 | Tragic 3.14 |
| Colville | 0.2 /100 | #298 | Tragic 3.14 |
| Canadians | 0.2 /100 | #299 | Tragic 3.14 |
| Immigrants | Sweden | 0.2 /100 | #300 | Tragic 3.14 |
| Macedonians | 0.2 /100 | #301 | Tragic 3.13 |
| Immigrants | Latvia | 0.2 /100 | #302 | Tragic 3.13 |
| British | 0.2 /100 | #303 | Tragic 3.13 |
| Immigrants | Switzerland | 0.2 /100 | #304 | Tragic 3.13 |
| Australians | 0.1 /100 | #305 | Tragic 3.13 |
| Immigrants | Ireland | 0.1 /100 | #306 | Tragic 3.13 |
| Immigrants | Serbia | 0.1 /100 | #307 | Tragic 3.13 |