Nigerian vs Immigrants from Cuba Average Family Size
COMPARE
Nigerian
Immigrants from Cuba
Average Family Size
Average Family Size Comparison
Nigerians
Immigrants from Cuba
3.29
AVERAGE FAMILY SIZE
98.6/ 100
METRIC RATING
99th/ 347
METRIC RANK
3.26
AVERAGE FAMILY SIZE
91.3/ 100
METRIC RATING
125th/ 347
METRIC RANK
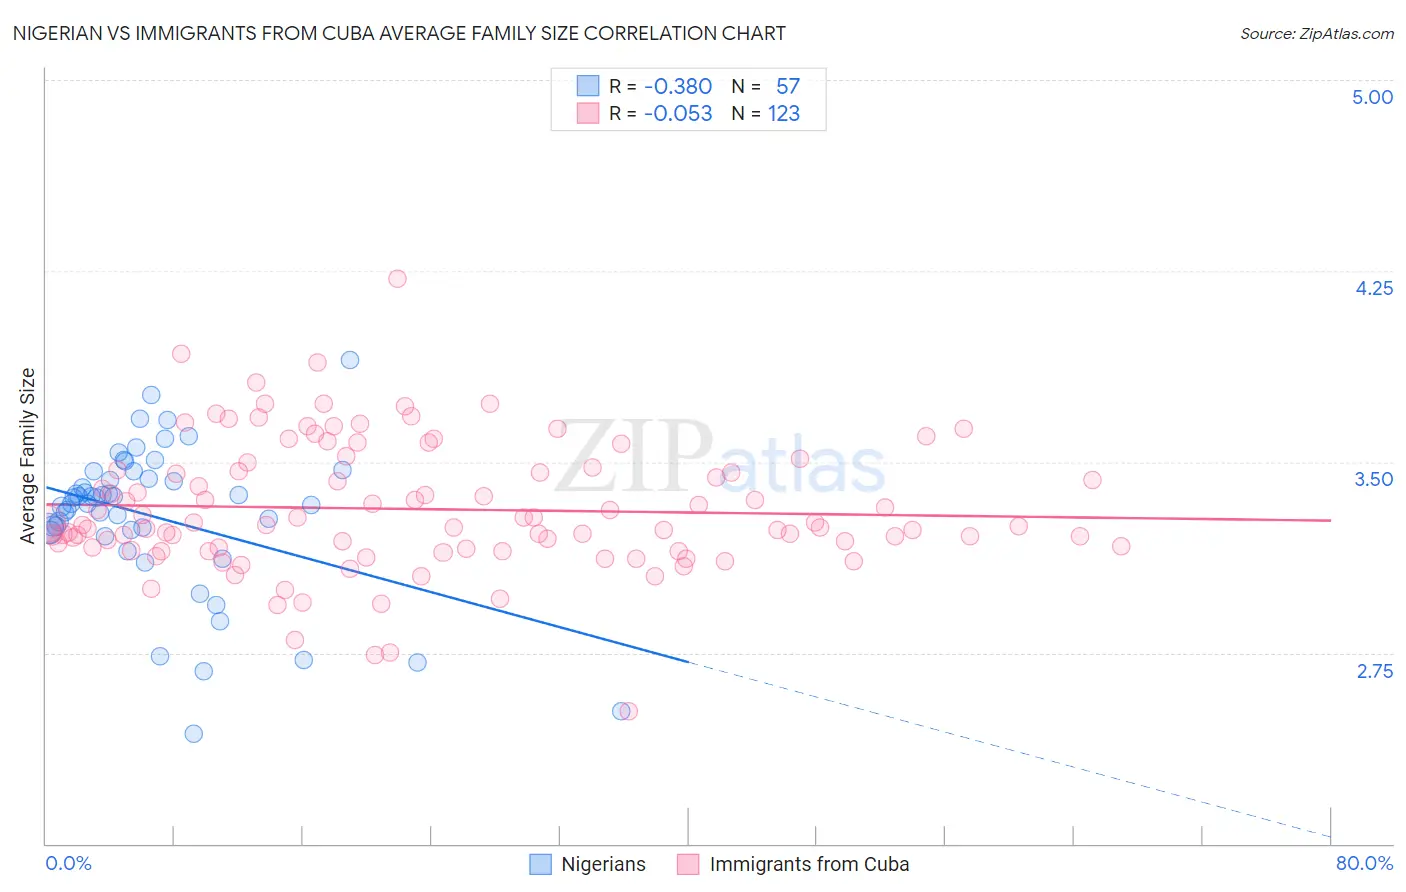
Nigerian vs Immigrants from Cuba Average Family Size Correlation Chart
The statistical analysis conducted on geographies consisting of 332,464,526 people shows a mild negative correlation between the proportion of Nigerians and average family size in the United States with a correlation coefficient (R) of -0.380 and weighted average of 3.29. Similarly, the statistical analysis conducted on geographies consisting of 325,939,675 people shows a slight negative correlation between the proportion of Immigrants from Cuba and average family size in the United States with a correlation coefficient (R) of -0.053 and weighted average of 3.26, a difference of 0.87%.
Average Family Size Correlation Summary
| Measurement | Nigerian | Immigrants from Cuba |
| Minimum | 2.43 | 2.52 |
| Maximum | 3.90 | 4.22 |
| Range | 1.47 | 1.70 |
| Mean | 3.28 | 3.31 |
| Median | 3.34 | 3.25 |
| Interquartile 25% (IQ1) | 3.23 | 3.16 |
| Interquartile 75% (IQ3) | 3.45 | 3.47 |
| Interquartile Range (IQR) | 0.22 | 0.31 |
| Standard Deviation (Sample) | 0.29 | 0.26 |
| Standard Deviation (Population) | 0.29 | 0.26 |
Similar Demographics by Average Family Size
Demographics Similar to Nigerians by Average Family Size
In terms of average family size, the demographic groups most similar to Nigerians are Barbadian (3.29, a difference of 0.0%), Immigrants from Oceania (3.29, a difference of 0.010%), Guamanian/Chamorro (3.29, a difference of 0.010%), Immigrants from Burma/Myanmar (3.29, a difference of 0.020%), and West Indian (3.29, a difference of 0.030%).
| Demographics | Rating | Rank | Average Family Size |
| Immigrants | Cameroon | 99.2 /100 | #92 | Exceptional 3.30 |
| Peruvians | 99.2 /100 | #93 | Exceptional 3.30 |
| Sierra Leoneans | 99.0 /100 | #94 | Exceptional 3.30 |
| Immigrants | Lebanon | 99.0 /100 | #95 | Exceptional 3.30 |
| U.S. Virgin Islanders | 98.8 /100 | #96 | Exceptional 3.29 |
| Immigrants | Oceania | 98.7 /100 | #97 | Exceptional 3.29 |
| Barbadians | 98.6 /100 | #98 | Exceptional 3.29 |
| Nigerians | 98.6 /100 | #99 | Exceptional 3.29 |
| Guamanians/Chamorros | 98.6 /100 | #100 | Exceptional 3.29 |
| Immigrants | Burma/Myanmar | 98.6 /100 | #101 | Exceptional 3.29 |
| West Indians | 98.5 /100 | #102 | Exceptional 3.29 |
| Immigrants | Western Africa | 98.4 /100 | #103 | Exceptional 3.29 |
| Bolivians | 98.3 /100 | #104 | Exceptional 3.29 |
| Immigrants | Ghana | 98.1 /100 | #105 | Exceptional 3.29 |
| Paiute | 98.0 /100 | #106 | Exceptional 3.29 |
Demographics Similar to Immigrants from Cuba by Average Family Size
In terms of average family size, the demographic groups most similar to Immigrants from Cuba are South American Indian (3.26, a difference of 0.020%), Immigrants from Costa Rica (3.26, a difference of 0.030%), Immigrants from Syria (3.26, a difference of 0.040%), Alaskan Athabascan (3.27, a difference of 0.070%), and Colombian (3.26, a difference of 0.080%).
| Demographics | Rating | Rank | Average Family Size |
| Immigrants | Asia | 94.0 /100 | #118 | Exceptional 3.27 |
| Immigrants | Indonesia | 93.7 /100 | #119 | Exceptional 3.27 |
| Immigrants | Bahamas | 93.6 /100 | #120 | Exceptional 3.27 |
| Immigrants | Thailand | 93.3 /100 | #121 | Exceptional 3.27 |
| Immigrants | Colombia | 92.8 /100 | #122 | Exceptional 3.27 |
| Alaskan Athabascans | 92.4 /100 | #123 | Exceptional 3.27 |
| South American Indians | 91.6 /100 | #124 | Exceptional 3.26 |
| Immigrants | Cuba | 91.3 /100 | #125 | Exceptional 3.26 |
| Immigrants | Costa Rica | 90.7 /100 | #126 | Exceptional 3.26 |
| Immigrants | Syria | 90.6 /100 | #127 | Exceptional 3.26 |
| Colombians | 89.9 /100 | #128 | Excellent 3.26 |
| Immigrants | Hong Kong | 88.6 /100 | #129 | Excellent 3.26 |
| Laotians | 88.5 /100 | #130 | Excellent 3.26 |
| Immigrants | Western Asia | 87.7 /100 | #131 | Excellent 3.26 |
| Costa Ricans | 86.8 /100 | #132 | Excellent 3.26 |