Nigerian vs Immigrants from Ireland Family Households
COMPARE
Nigerian
Immigrants from Ireland
Family Households
Family Households Comparison
Nigerians
Immigrants from Ireland
63.9%
FAMILY HOUSEHOLDS
11.5/ 100
METRIC RATING
207th/ 347
METRIC RANK
63.2%
FAMILY HOUSEHOLDS
0.6/ 100
METRIC RATING
262nd/ 347
METRIC RANK
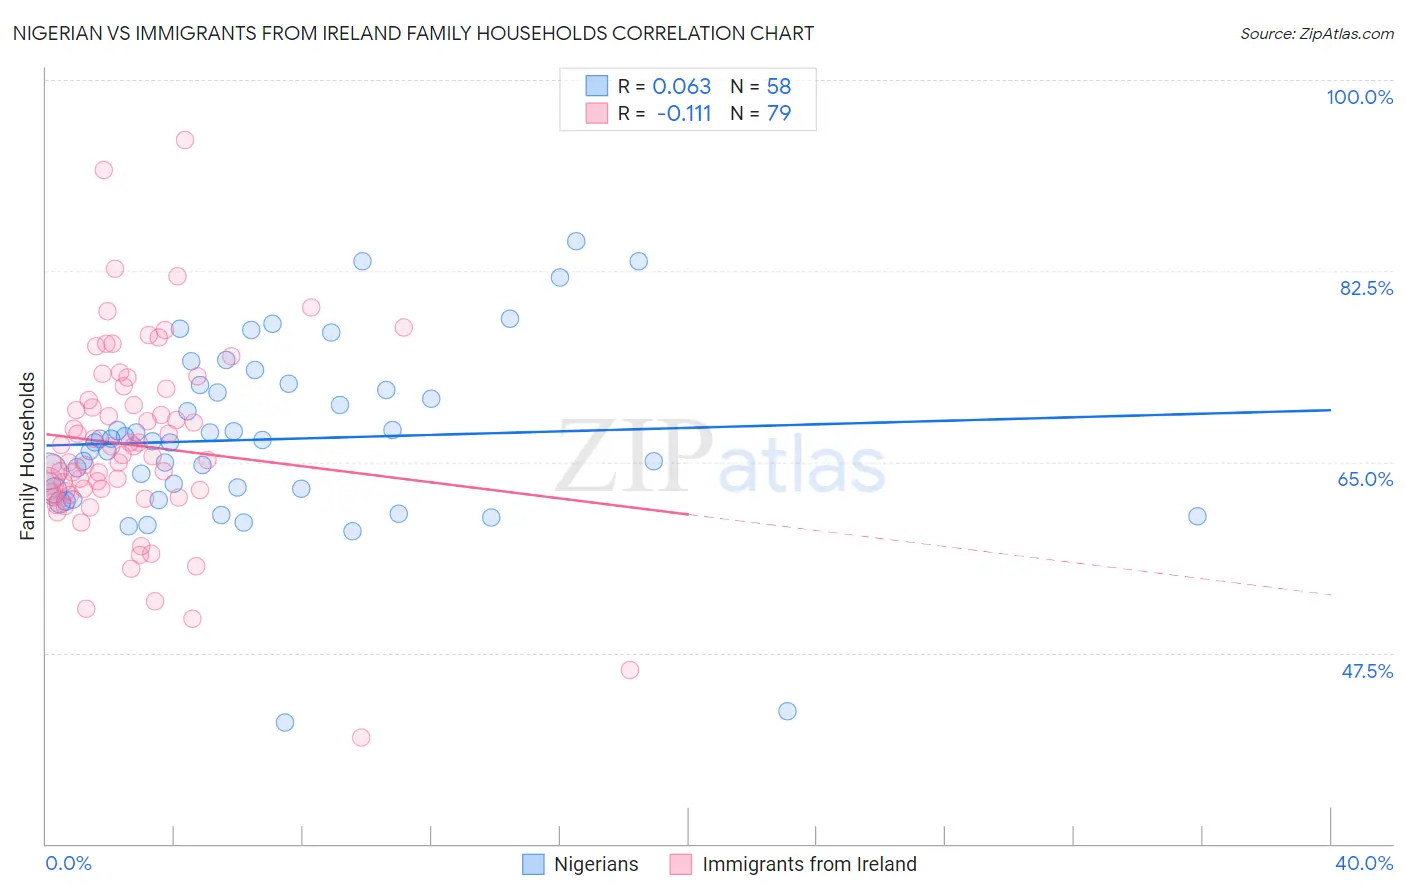
Nigerian vs Immigrants from Ireland Family Households Correlation Chart
The statistical analysis conducted on geographies consisting of 332,466,874 people shows a slight positive correlation between the proportion of Nigerians and percentage of family households in the United States with a correlation coefficient (R) of 0.063 and weighted average of 63.9%. Similarly, the statistical analysis conducted on geographies consisting of 240,750,325 people shows a poor negative correlation between the proportion of Immigrants from Ireland and percentage of family households in the United States with a correlation coefficient (R) of -0.111 and weighted average of 63.2%, a difference of 1.1%.
Family Households Correlation Summary
| Measurement | Nigerian | Immigrants from Ireland |
| Minimum | 41.2% | 39.8% |
| Maximum | 85.2% | 94.4% |
| Range | 44.1% | 54.7% |
| Mean | 67.1% | 66.5% |
| Median | 66.9% | 65.5% |
| Interquartile 25% (IQ1) | 62.4% | 62.1% |
| Interquartile 75% (IQ3) | 71.6% | 71.7% |
| Interquartile Range (IQR) | 9.2% | 9.7% |
| Standard Deviation (Sample) | 8.2% | 8.8% |
| Standard Deviation (Population) | 8.2% | 8.8% |
Similar Demographics by Family Households
Demographics Similar to Nigerians by Family Households
In terms of family households, the demographic groups most similar to Nigerians are Immigrants from Bangladesh (63.9%, a difference of 0.0%), Sierra Leonean (63.9%, a difference of 0.010%), Immigrants from Lithuania (63.9%, a difference of 0.020%), Brazilian (63.9%, a difference of 0.030%), and Immigrants from Uruguay (63.9%, a difference of 0.040%).
| Demographics | Rating | Rank | Family Households |
| Immigrants | Malaysia | 17.9 /100 | #200 | Poor 64.0% |
| Immigrants | Eastern Europe | 17.2 /100 | #201 | Poor 64.0% |
| Iranians | 13.5 /100 | #202 | Poor 63.9% |
| Norwegians | 13.2 /100 | #203 | Poor 63.9% |
| Immigrants | Uruguay | 12.8 /100 | #204 | Poor 63.9% |
| Brazilians | 12.4 /100 | #205 | Poor 63.9% |
| Immigrants | Lithuania | 12.1 /100 | #206 | Poor 63.9% |
| Nigerians | 11.5 /100 | #207 | Poor 63.9% |
| Immigrants | Bangladesh | 11.4 /100 | #208 | Poor 63.9% |
| Sierra Leoneans | 11.2 /100 | #209 | Poor 63.9% |
| Immigrants | Thailand | 9.6 /100 | #210 | Tragic 63.8% |
| Shoshone | 9.4 /100 | #211 | Tragic 63.8% |
| Immigrants | Netherlands | 9.4 /100 | #212 | Tragic 63.8% |
| Immigrants | Northern Europe | 8.8 /100 | #213 | Tragic 63.8% |
| Celtics | 8.0 /100 | #214 | Tragic 63.8% |
Demographics Similar to Immigrants from Ireland by Family Households
In terms of family households, the demographic groups most similar to Immigrants from Ireland are Immigrants from Russia (63.2%, a difference of 0.010%), Cheyenne (63.2%, a difference of 0.020%), Cypriot (63.2%, a difference of 0.030%), Kenyan (63.2%, a difference of 0.030%), and Colville (63.2%, a difference of 0.040%).
| Demographics | Rating | Rank | Family Households |
| Potawatomi | 1.0 /100 | #255 | Tragic 63.3% |
| Luxembourgers | 0.9 /100 | #256 | Tragic 63.3% |
| Icelanders | 0.8 /100 | #257 | Tragic 63.3% |
| Immigrants | Barbados | 0.7 /100 | #258 | Tragic 63.2% |
| Immigrants | Western Europe | 0.6 /100 | #259 | Tragic 63.2% |
| Cypriots | 0.6 /100 | #260 | Tragic 63.2% |
| Immigrants | Russia | 0.6 /100 | #261 | Tragic 63.2% |
| Immigrants | Ireland | 0.6 /100 | #262 | Tragic 63.2% |
| Cheyenne | 0.5 /100 | #263 | Tragic 63.2% |
| Kenyans | 0.5 /100 | #264 | Tragic 63.2% |
| Colville | 0.5 /100 | #265 | Tragic 63.2% |
| Immigrants | Western Africa | 0.5 /100 | #266 | Tragic 63.1% |
| Israelis | 0.4 /100 | #267 | Tragic 63.1% |
| Immigrants | Singapore | 0.4 /100 | #268 | Tragic 63.1% |
| Yugoslavians | 0.4 /100 | #269 | Tragic 63.1% |