Irish vs Immigrants from Ireland Family Households
COMPARE
Irish
Immigrants from Ireland
Family Households
Family Households Comparison
Irish
Immigrants from Ireland
64.4%
FAMILY HOUSEHOLDS
57.9/ 100
METRIC RATING
167th/ 347
METRIC RANK
63.2%
FAMILY HOUSEHOLDS
0.6/ 100
METRIC RATING
262nd/ 347
METRIC RANK
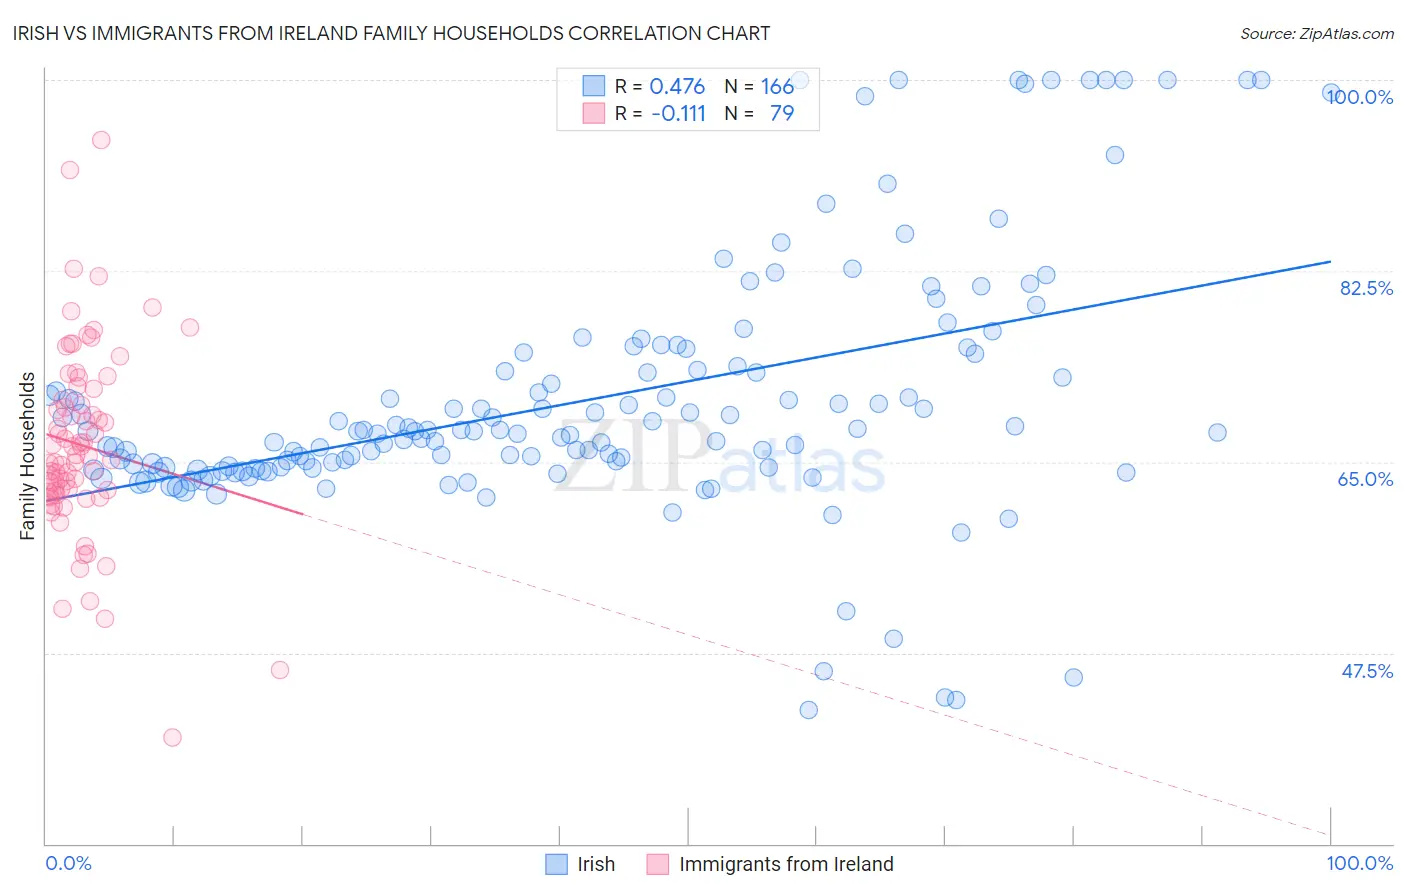
Irish vs Immigrants from Ireland Family Households Correlation Chart
The statistical analysis conducted on geographies consisting of 580,015,491 people shows a moderate positive correlation between the proportion of Irish and percentage of family households in the United States with a correlation coefficient (R) of 0.476 and weighted average of 64.4%. Similarly, the statistical analysis conducted on geographies consisting of 240,750,325 people shows a poor negative correlation between the proportion of Immigrants from Ireland and percentage of family households in the United States with a correlation coefficient (R) of -0.111 and weighted average of 63.2%, a difference of 1.9%.
Family Households Correlation Summary
| Measurement | Irish | Immigrants from Ireland |
| Minimum | 42.2% | 39.8% |
| Maximum | 100.0% | 94.4% |
| Range | 57.8% | 54.7% |
| Mean | 70.7% | 66.5% |
| Median | 67.8% | 65.5% |
| Interquartile 25% (IQ1) | 64.5% | 62.1% |
| Interquartile 75% (IQ3) | 73.8% | 71.7% |
| Interquartile Range (IQR) | 9.3% | 9.7% |
| Standard Deviation (Sample) | 11.6% | 8.8% |
| Standard Deviation (Population) | 11.5% | 8.8% |
Similar Demographics by Family Households
Demographics Similar to Irish by Family Households
In terms of family households, the demographic groups most similar to Irish are Honduran (64.4%, a difference of 0.010%), Scotch-Irish (64.4%, a difference of 0.020%), Immigrants from Nigeria (64.4%, a difference of 0.030%), Immigrants from Southern Europe (64.4%, a difference of 0.030%), and Iraqi (64.4%, a difference of 0.030%).
| Demographics | Rating | Rank | Family Households |
| Immigrants | Moldova | 65.2 /100 | #160 | Good 64.4% |
| Immigrants | England | 62.6 /100 | #161 | Good 64.4% |
| British | 61.6 /100 | #162 | Good 64.4% |
| Chickasaw | 61.5 /100 | #163 | Good 64.4% |
| Immigrants | Nigeria | 60.1 /100 | #164 | Good 64.4% |
| Immigrants | Southern Europe | 60.0 /100 | #165 | Good 64.4% |
| Scotch-Irish | 59.2 /100 | #166 | Average 64.4% |
| Irish | 57.9 /100 | #167 | Average 64.4% |
| Hondurans | 57.5 /100 | #168 | Average 64.4% |
| Iraqis | 56.0 /100 | #169 | Average 64.4% |
| Armenians | 55.9 /100 | #170 | Average 64.4% |
| Ute | 54.6 /100 | #171 | Average 64.3% |
| Dutch West Indians | 53.9 /100 | #172 | Average 64.3% |
| Immigrants | Sierra Leone | 52.5 /100 | #173 | Average 64.3% |
| Immigrants | Germany | 50.0 /100 | #174 | Average 64.3% |
Demographics Similar to Immigrants from Ireland by Family Households
In terms of family households, the demographic groups most similar to Immigrants from Ireland are Immigrants from Russia (63.2%, a difference of 0.010%), Cheyenne (63.2%, a difference of 0.020%), Cypriot (63.2%, a difference of 0.030%), Kenyan (63.2%, a difference of 0.030%), and Colville (63.2%, a difference of 0.040%).
| Demographics | Rating | Rank | Family Households |
| Potawatomi | 1.0 /100 | #255 | Tragic 63.3% |
| Luxembourgers | 0.9 /100 | #256 | Tragic 63.3% |
| Icelanders | 0.8 /100 | #257 | Tragic 63.3% |
| Immigrants | Barbados | 0.7 /100 | #258 | Tragic 63.2% |
| Immigrants | Western Europe | 0.6 /100 | #259 | Tragic 63.2% |
| Cypriots | 0.6 /100 | #260 | Tragic 63.2% |
| Immigrants | Russia | 0.6 /100 | #261 | Tragic 63.2% |
| Immigrants | Ireland | 0.6 /100 | #262 | Tragic 63.2% |
| Cheyenne | 0.5 /100 | #263 | Tragic 63.2% |
| Kenyans | 0.5 /100 | #264 | Tragic 63.2% |
| Colville | 0.5 /100 | #265 | Tragic 63.2% |
| Immigrants | Western Africa | 0.5 /100 | #266 | Tragic 63.1% |
| Israelis | 0.4 /100 | #267 | Tragic 63.1% |
| Immigrants | Singapore | 0.4 /100 | #268 | Tragic 63.1% |
| Yugoslavians | 0.4 /100 | #269 | Tragic 63.1% |