Nigerian vs Chickasaw Family Households with Children
COMPARE
Nigerian
Chickasaw
Family Households with Children
Family Households with Children Comparison
Nigerians
Chickasaw
28.4%
FAMILY HOUSEHOLDS WITH CHILDREN
99.8/ 100
METRIC RATING
77th/ 347
METRIC RANK
28.2%
FAMILY HOUSEHOLDS WITH CHILDREN
99.4/ 100
METRIC RATING
92nd/ 347
METRIC RANK
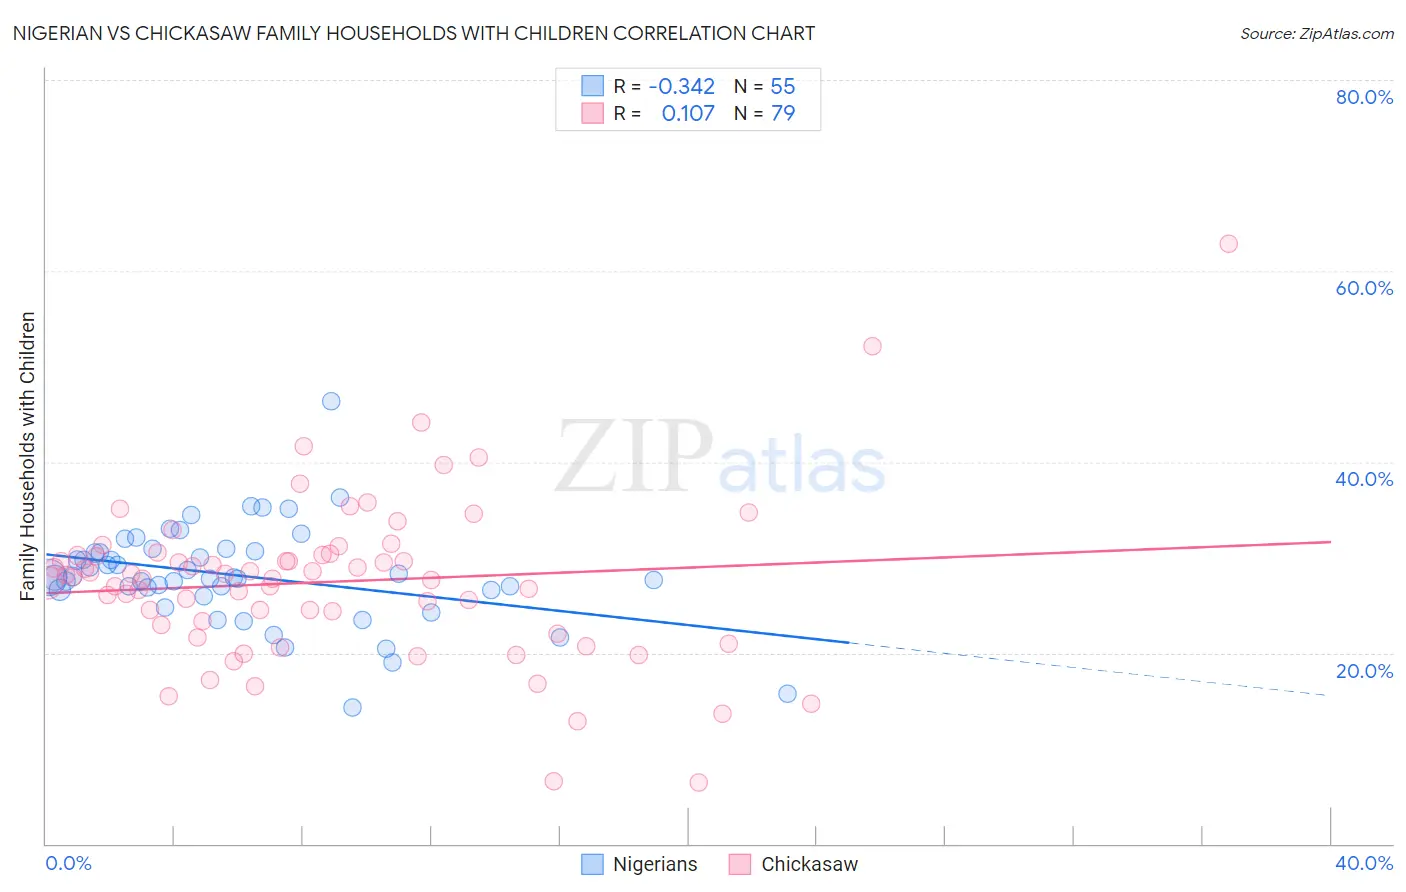
Nigerian vs Chickasaw Family Households with Children Correlation Chart
The statistical analysis conducted on geographies consisting of 332,387,901 people shows a mild negative correlation between the proportion of Nigerians and percentage of family households with children in the United States with a correlation coefficient (R) of -0.342 and weighted average of 28.4%. Similarly, the statistical analysis conducted on geographies consisting of 147,673,787 people shows a poor positive correlation between the proportion of Chickasaw and percentage of family households with children in the United States with a correlation coefficient (R) of 0.107 and weighted average of 28.2%, a difference of 0.73%.
Family Households with Children Correlation Summary
| Measurement | Nigerian | Chickasaw |
| Minimum | 14.3% | 6.5% |
| Maximum | 46.4% | 62.8% |
| Range | 32.1% | 56.3% |
| Mean | 28.1% | 27.4% |
| Median | 27.9% | 27.9% |
| Interquartile 25% (IQ1) | 26.5% | 22.9% |
| Interquartile 75% (IQ3) | 30.6% | 30.3% |
| Interquartile Range (IQR) | 4.1% | 7.4% |
| Standard Deviation (Sample) | 5.2% | 8.6% |
| Standard Deviation (Population) | 5.2% | 8.5% |
Demographics Similar to Nigerians and Chickasaw by Family Households with Children
In terms of family households with children, the demographic groups most similar to Nigerians are Immigrants from Nepal (28.4%, a difference of 0.040%), Immigrants from Sri Lanka (28.4%, a difference of 0.050%), Immigrants from Jordan (28.4%, a difference of 0.060%), Immigrants from Iraq (28.4%, a difference of 0.070%), and Native/Alaskan (28.4%, a difference of 0.080%). Similarly, the demographic groups most similar to Chickasaw are Immigrants from Liberia (28.2%, a difference of 0.020%), Immigrants from Thailand (28.2%, a difference of 0.070%), Panamanian (28.2%, a difference of 0.11%), Immigrants from Colombia (28.2%, a difference of 0.15%), and Immigrants from Costa Rica (28.3%, a difference of 0.18%).
| Demographics | Rating | Rank | Family Households with Children |
| Laotians | 99.9 /100 | #74 | Exceptional 28.5% |
| Immigrants | Jordan | 99.9 /100 | #75 | Exceptional 28.4% |
| Immigrants | Sri Lanka | 99.9 /100 | #76 | Exceptional 28.4% |
| Nigerians | 99.8 /100 | #77 | Exceptional 28.4% |
| Immigrants | Nepal | 99.8 /100 | #78 | Exceptional 28.4% |
| Immigrants | Iraq | 99.8 /100 | #79 | Exceptional 28.4% |
| Natives/Alaskans | 99.8 /100 | #80 | Exceptional 28.4% |
| South Americans | 99.8 /100 | #81 | Exceptional 28.4% |
| Kenyans | 99.8 /100 | #82 | Exceptional 28.4% |
| Nicaraguans | 99.8 /100 | #83 | Exceptional 28.4% |
| Costa Ricans | 99.8 /100 | #84 | Exceptional 28.4% |
| Immigrants | Syria | 99.8 /100 | #85 | Exceptional 28.4% |
| Immigrants | Western Africa | 99.6 /100 | #86 | Exceptional 28.3% |
| Colombians | 99.6 /100 | #87 | Exceptional 28.3% |
| Liberians | 99.6 /100 | #88 | Exceptional 28.3% |
| Immigrants | Costa Rica | 99.6 /100 | #89 | Exceptional 28.3% |
| Immigrants | Thailand | 99.5 /100 | #90 | Exceptional 28.2% |
| Immigrants | Liberia | 99.4 /100 | #91 | Exceptional 28.2% |
| Chickasaw | 99.4 /100 | #92 | Exceptional 28.2% |
| Panamanians | 99.3 /100 | #93 | Exceptional 28.2% |
| Immigrants | Colombia | 99.2 /100 | #94 | Exceptional 28.2% |