Native/Alaskan vs Immigrants from Russia Currently Married

COMPARE

Native/Alaskan
Race
Ancestry
AfghanAfricanAlaska NativeAlaskan AthabascanAlbanianAleutAlsatianAmericanApacheArabArapahoArgentineanArmenianAssyrian/Chaldean/SyriacAustralianAustrianBahamianBangladeshiBarbadianBasqueBelgianBelizeanBermudanBhutaneseBlackfeetBolivianBrazilianBritishBritish West IndianBulgarianBurmeseCajunCambodianCanadianCape VerdeanCarpatho RusynCelticCentral AmericanCentral American IndianCherokeeCheyenneChickasawChileanChineseChippewaChoctawColombianColvilleComancheCosta RicanCreeCreekCroatianCrowCubanCypriotCzechCzechoslovakianDanishDelawareDominicanDutchDutch West IndianEastern EuropeanEcuadorianEgyptianEnglishEstonianEthiopianEuropeanFijianFilipinoFinnishFrenchFrench American IndianFrench CanadianGermanGerman RussianGhanaianGreekGuamanian/ChamorroGuatemalanGuyaneseHaitianHmongHonduranHopiHoumaHungarianIcelanderIndian (Asian)IndonesianInupiatIranianIraqiIrishIroquoisIsraeliItalianJamaicanJapaneseJordanianKenyanKiowaKoreanLaotianLatvianLebaneseLiberianLithuanianLumbeeLuxembourgerMacedonianMalaysianMalteseMarshalleseMenomineeMexicanMexican American IndianMongolianMoroccanNative HawaiianNavajoNepaleseNew ZealanderNicaraguanNigerianNorthern EuropeanNorwegianOkinawanOsageOttawaPaiutePakistaniPalestinianPanamanianParaguayanPennsylvania GermanPeruvianPimaPolishPortuguesePotawatomiPuebloPuerto RicanPuget Sound SalishRomanianRussianSalvadoranSamoanScandinavianScotch-IrishScottishSeminoleSenegaleseSerbianShoshoneSierra LeoneanSiouxSlavicSlovakSloveneSomaliSouth AfricanSouth AmericanSouth American IndianSoviet UnionSpaniardSpanishSpanish AmericanSpanish American IndianSri LankanSubsaharan AfricanSudaneseSwedishSwissSyrianTaiwaneseThaiTlingit-HaidaTohono O'OdhamTonganTrinidadian and TobagonianTsimshianTurkishU.S. Virgin IslanderUgandanUkrainianUruguayanUteVenezuelanVietnameseWelshWest IndianYakamaYaquiYugoslavianYumanYup'ikZimbabwean
Immigration
NonimmigrantsImmigrantsAfghanistanAfricaAlbaniaArgentinaArmeniaAsiaAustraliaAustriaBahamasBangladeshBarbadosBelarusBelgiumBelizeBoliviaBosnia and HerzegovinaBrazilBulgariaBurma/MyanmarCabo VerdeCambodiaCameroonCanadaCaribbeanCentral AmericaChileChinaColombiaCongoCosta RicaCroatiaCubaCzechoslovakiaDenmarkDominicaDominican RepublicEastern AfricaEastern AsiaEastern EuropeEcuadorEgyptEl SalvadorEnglandEritreaEthiopiaEuropeFijiFranceGermanyGhanaGreeceGrenadaGuatemalaGuyanaHaitiHondurasHong KongHungaryIndiaIndonesiaIranIraqIrelandIsraelItalyJamaicaJapanJordanKazakhstanKenyaKoreaKuwaitLaosLatin AmericaLatviaLebanonLiberiaLithuaniaMalaysiaMexicoMicronesiaMiddle AfricaMoldovaMoroccoNepalNetherlandsNicaraguaNigeriaNorth AmericaNorth MacedoniaNorthern AfricaNorthern EuropeNorwayOceaniaPakistanPanamaPeruPhilippinesPolandPortugalRomaniaSaudi ArabiaScotlandSenegalSerbiaSierra LeoneSingaporeSomaliaSouth AfricaSouth AmericaSouth Central AsiaSouth Eastern AsiaSouthern EuropeSpainSri LankaSt. Vincent and the GrenadinesSudanSwedenSwitzerlandSyriaTaiwanThailandTrinidad and TobagoTurkeyUgandaUkraineUruguayUzbekistanVenezuelaVietnamWest IndiesWestern AfricaWestern AsiaWestern EuropeYemenZaireZimbabweAzores
Immigrants from Russia
Race
Ancestry
AfghanAfricanAlaska NativeAlaskan AthabascanAlbanianAleutAlsatianAmericanApacheArabArapahoArgentineanArmenianAssyrian/Chaldean/SyriacAustralianAustrianBahamianBangladeshiBarbadianBasqueBelgianBelizeanBermudanBhutaneseBlackfeetBolivianBrazilianBritishBritish West IndianBulgarianBurmeseCajunCambodianCanadianCape VerdeanCarpatho RusynCelticCentral AmericanCentral American IndianCherokeeCheyenneChickasawChileanChineseChippewaChoctawColombianColvilleComancheCosta RicanCreeCreekCroatianCrowCubanCypriotCzechCzechoslovakianDanishDelawareDominicanDutchDutch West IndianEastern EuropeanEcuadorianEgyptianEnglishEstonianEthiopianEuropeanFijianFilipinoFinnishFrenchFrench American IndianFrench CanadianGermanGerman RussianGhanaianGreekGuamanian/ChamorroGuatemalanGuyaneseHaitianHmongHonduranHopiHoumaHungarianIcelanderIndian (Asian)IndonesianInupiatIranianIraqiIrishIroquoisIsraeliItalianJamaicanJapaneseJordanianKenyanKiowaKoreanLaotianLatvianLebaneseLiberianLithuanianLumbeeLuxembourgerMacedonianMalaysianMalteseMarshalleseMenomineeMexicanMexican American IndianMongolianMoroccanNative HawaiianNavajoNepaleseNew ZealanderNicaraguanNigerianNorthern EuropeanNorwegianOkinawanOsageOttawaPaiutePakistaniPalestinianPanamanianParaguayanPennsylvania GermanPeruvianPimaPolishPortuguesePotawatomiPuebloPuerto RicanPuget Sound SalishRomanianRussianSalvadoranSamoanScandinavianScotch-IrishScottishSeminoleSenegaleseSerbianShoshoneSierra LeoneanSiouxSlavicSlovakSloveneSomaliSouth AfricanSouth AmericanSouth American IndianSoviet UnionSpaniardSpanishSpanish AmericanSpanish American IndianSri LankanSubsaharan AfricanSudaneseSwedishSwissSyrianTaiwaneseThaiTlingit-HaidaTohono O'OdhamTonganTrinidadian and TobagonianTsimshianTurkishU.S. Virgin IslanderUgandanUkrainianUruguayanUteVenezuelanVietnameseWelshWest IndianYakamaYaquiYugoslavianYumanYup'ikZimbabwean
Immigration
NonimmigrantsImmigrantsAfghanistanAfricaAlbaniaArgentinaArmeniaAsiaAustraliaAustriaBahamasBangladeshBarbadosBelarusBelgiumBelizeBoliviaBosnia and HerzegovinaBrazilBulgariaBurma/MyanmarCabo VerdeCambodiaCameroonCanadaCaribbeanCentral AmericaChileChinaColombiaCongoCosta RicaCroatiaCubaCzechoslovakiaDenmarkDominicaDominican RepublicEastern AfricaEastern AsiaEastern EuropeEcuadorEgyptEl SalvadorEnglandEritreaEthiopiaEuropeFijiFranceGermanyGhanaGreeceGrenadaGuatemalaGuyanaHaitiHondurasHong KongHungaryIndiaIndonesiaIranIraqIrelandIsraelItalyJamaicaJapanJordanKazakhstanKenyaKoreaKuwaitLaosLatin AmericaLatviaLebanonLiberiaLithuaniaMalaysiaMexicoMicronesiaMiddle AfricaMoldovaMoroccoNepalNetherlandsNicaraguaNigeriaNorth AmericaNorth MacedoniaNorthern AfricaNorthern EuropeNorwayOceaniaPakistanPanamaPeruPhilippinesPolandPortugalRomaniaRussiaSaudi ArabiaScotlandSenegalSerbiaSierra LeoneSingaporeSomaliaSouth AfricaSouth AmericaSouth Central AsiaSouth Eastern AsiaSouthern EuropeSpainSri LankaSt. Vincent and the GrenadinesSudanSwedenSwitzerlandSyriaTaiwanThailandTrinidad and TobagoTurkeyUgandaUkraineUruguayUzbekistanVenezuelaVietnamWest IndiesWestern AfricaWestern AsiaWestern EuropeYemenZaireZimbabweAzores
Currently Married
Income
Poverty
Unemployment
Labor Participation
Family Structure
Vehicle Availability
Education Level
Disability

Currently Married Comparison

Natives/Alaskans

Immigrants from Russia

Tragic
Exceptional
42.8%
CURRENTLY MARRIED
0.0/ 100
METRIC RATING
288th/ 347
METRIC RANK
47.7%
CURRENTLY MARRIED
92.0/ 100
METRIC RATING
110th/ 347
METRIC RANK

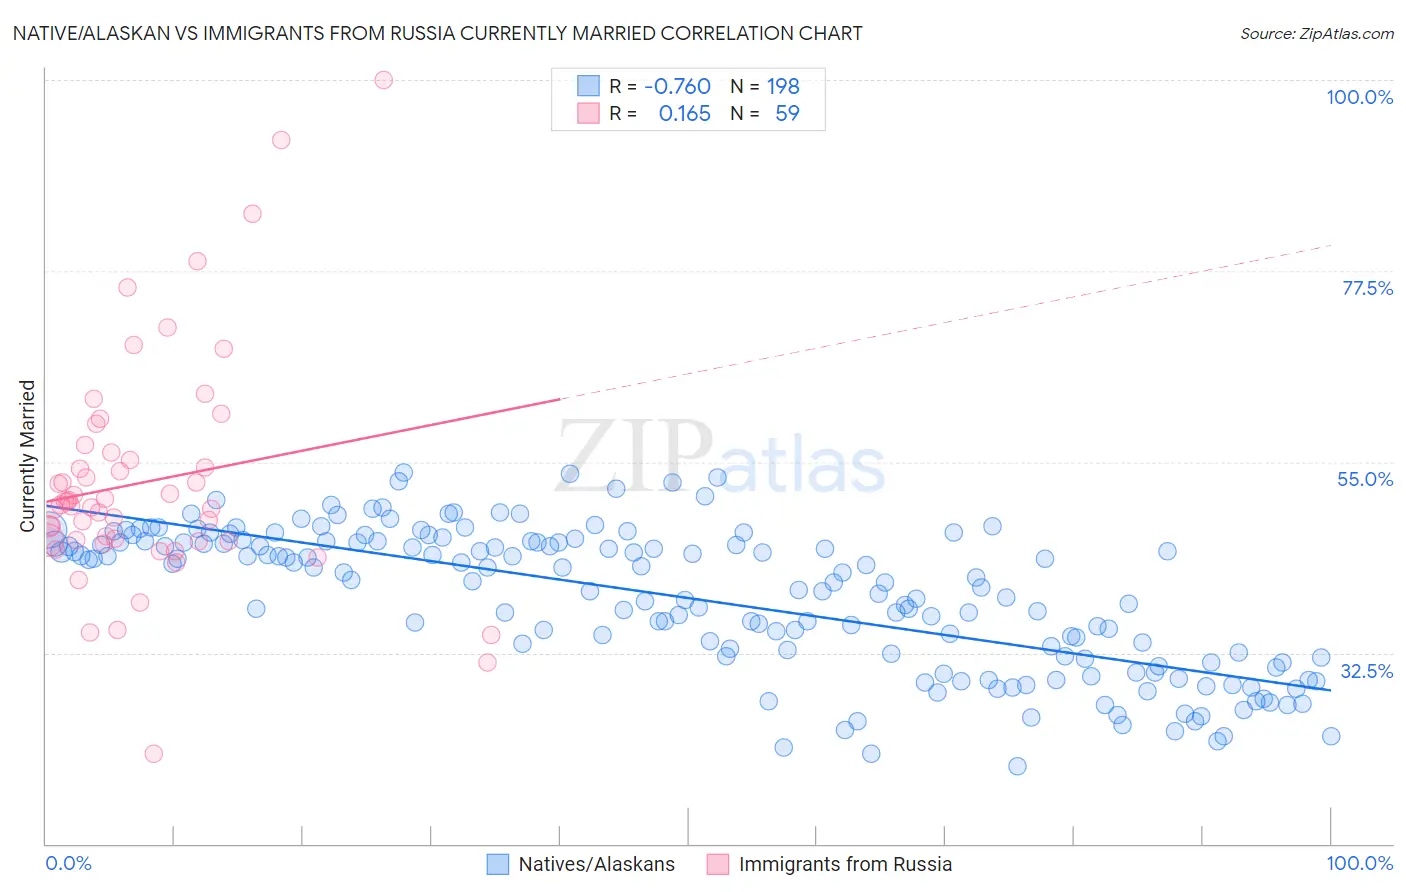
Native/Alaskan vs Immigrants from Russia Currently Married Correlation Chart

The statistical analysis conducted on geographies consisting of 512,977,387 people shows a strong negative correlation between the proportion of Natives/Alaskans and percentage of population currently married in the United States with a correlation coefficient (R) of -0.760 and weighted average of 42.8%. Similarly, the statistical analysis conducted on geographies consisting of 347,902,051 people shows a poor positive correlation between the proportion of Immigrants from Russia and percentage of population currently married in the United States with a correlation coefficient (R) of 0.165 and weighted average of 47.7%, a difference of 11.4%.
Native/Alaskan vs Immigrants from Russia Currently Married

Currently Married Correlation Summary

MeasurementNative/AlaskanImmigrants from Russia
Minimum19.1%20.6%
Maximum53.7%100.0%
Range34.6%79.4%
Mean38.9%52.6%
Median41.0%49.9%
Interquartile 25% (IQ1)32.1%45.6%
Interquartile 75% (IQ3)45.5%56.2%
Interquartile Range (IQR)13.5%10.6%
Standard Deviation (Sample)8.3%13.7%
Standard Deviation (Population)8.3%13.6%

Similar Demographics by Currently Married

Demographics Similar to Natives/Alaskans by Currently Married

In terms of currently married, the demographic groups most similar to Natives/Alaskans are Paiute (42.7%, a difference of 0.23%), Immigrants from Ghana (42.7%, a difference of 0.24%), Guatemalan (42.9%, a difference of 0.27%), Ghanaian (42.9%, a difference of 0.29%), and Immigrants from Guatemala (42.6%, a difference of 0.36%).
DemographicsRating | RankCurrently Married
Chippewa
0.0
/100
|
#281
Tragic
43.2%
Immigrants | Ecuador
0.0
/100
|
#282
Tragic
43.2%
Kiowa
0.0
/100
|
#283
Tragic
43.2%
Immigrants | El Salvador
0.0
/100
|
#284
Tragic
43.1%
Immigrants | Middle Africa
0.0
/100
|
#285
Tragic
43.0%
Ghanaians
0.0
/100
|
#286
Tragic
42.9%
Guatemalans
0.0
/100
|
#287
Tragic
42.9%
Natives/Alaskans
0.0
/100
|
#288
Tragic
42.8%
Paiute
0.0
/100
|
#289
Tragic
42.7%
Immigrants | Ghana
0.0
/100
|
#290
Tragic
42.7%
Immigrants | Guatemala
0.0
/100
|
#291
Tragic
42.6%
Sub-Saharan Africans
0.0
/100
|
#292
Tragic
42.6%
Yuman
0.0
/100
|
#293
Tragic
42.6%
Hondurans
0.0
/100
|
#294
Tragic
42.5%
Immigrants | Western Africa
0.0
/100
|
#295
Tragic
42.4%

Demographics Similar to Immigrants from Russia by Currently Married

In terms of currently married, the demographic groups most similar to Immigrants from Russia are Immigrants from Egypt (47.7%, a difference of 0.040%), Tsimshian (47.7%, a difference of 0.050%), Immigrants from Hungary (47.6%, a difference of 0.090%), Immigrants from Western Europe (47.6%, a difference of 0.10%), and Immigrants from Italy (47.7%, a difference of 0.11%).
DemographicsRating | RankCurrently Married
Cypriots
93.7
/100
|
#103
Exceptional
47.8%
Serbians
93.6
/100
|
#104
Exceptional
47.8%
Immigrants | Singapore
93.3
/100
|
#105
Exceptional
47.8%
Immigrants | Greece
93.1
/100
|
#106
Exceptional
47.7%
Immigrants | Italy
92.9
/100
|
#107
Exceptional
47.7%
Tsimshian
92.4
/100
|
#108
Exceptional
47.7%
Immigrants | Egypt
92.3
/100
|
#109
Exceptional
47.7%
Immigrants | Russia
92.0
/100
|
#110
Exceptional
47.7%
Immigrants | Hungary
91.2
/100
|
#111
Exceptional
47.6%
Immigrants | Western Europe
91.1
/100
|
#112
Exceptional
47.6%
Immigrants | Denmark
90.9
/100
|
#113
Exceptional
47.6%
South Africans
90.5
/100
|
#114
Exceptional
47.6%
Immigrants | Indonesia
90.5
/100
|
#115
Exceptional
47.6%
Palestinians
90.4
/100
|
#116
Exceptional
47.6%
Puget Sound Salish
90.3
/100
|
#117
Exceptional
47.6%