Mexican vs Laotian Single Mother Households
COMPARE
Mexican
Laotian
Single Mother Households
Single Mother Households Comparison
Mexicans
Laotians
8.0%
SINGLE MOTHER HOUSEHOLDS
0.0/ 100
METRIC RATING
300th/ 347
METRIC RANK
5.8%
SINGLE MOTHER HOUSEHOLDS
94.3/ 100
METRIC RATING
118th/ 347
METRIC RANK
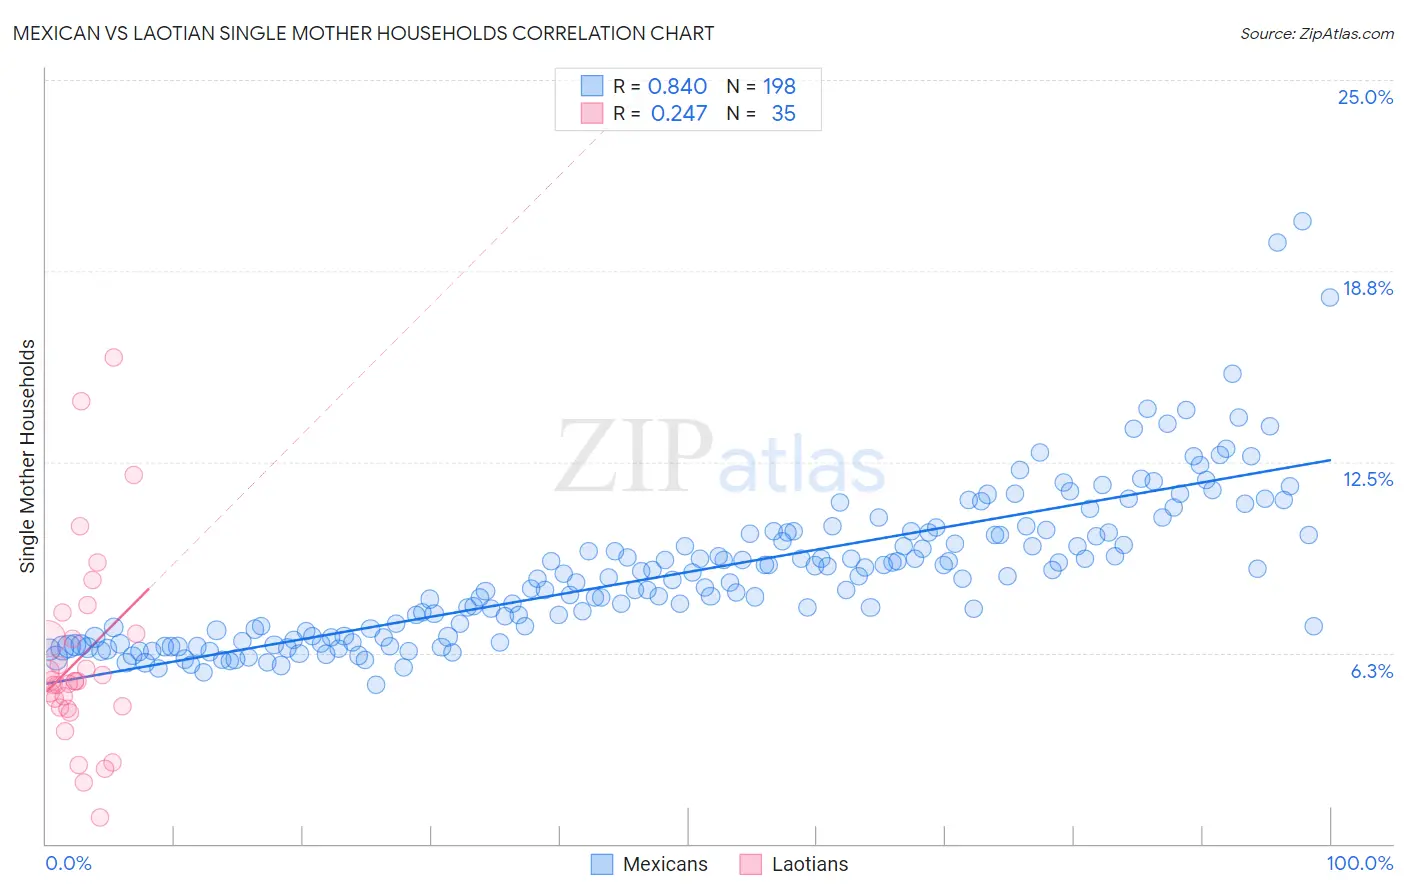
Mexican vs Laotian Single Mother Households Correlation Chart
The statistical analysis conducted on geographies consisting of 560,737,784 people shows a very strong positive correlation between the proportion of Mexicans and percentage of single mother households in the United States with a correlation coefficient (R) of 0.840 and weighted average of 8.0%. Similarly, the statistical analysis conducted on geographies consisting of 224,525,105 people shows a weak positive correlation between the proportion of Laotians and percentage of single mother households in the United States with a correlation coefficient (R) of 0.247 and weighted average of 5.8%, a difference of 36.7%.
Single Mother Households Correlation Summary
| Measurement | Mexican | Laotian |
| Minimum | 5.2% | 0.87% |
| Maximum | 20.4% | 15.9% |
| Range | 15.2% | 15.0% |
| Mean | 8.9% | 6.1% |
| Median | 8.7% | 5.3% |
| Interquartile 25% (IQ1) | 6.8% | 4.5% |
| Interquartile 75% (IQ3) | 10.1% | 6.9% |
| Interquartile Range (IQR) | 3.4% | 2.4% |
| Standard Deviation (Sample) | 2.5% | 3.2% |
| Standard Deviation (Population) | 2.5% | 3.2% |
Similar Demographics by Single Mother Households
Demographics Similar to Mexicans by Single Mother Households
In terms of single mother households, the demographic groups most similar to Mexicans are Chippewa (8.0%, a difference of 0.16%), Immigrants from Ghana (8.0%, a difference of 0.25%), Immigrants from Bahamas (8.0%, a difference of 0.27%), Houma (7.9%, a difference of 0.46%), and Immigrants from West Indies (7.9%, a difference of 0.54%).
| Demographics | Rating | Rank | Single Mother Households |
| Immigrants | Cameroon | 0.0 /100 | #293 | Tragic 7.9% |
| Apache | 0.0 /100 | #294 | Tragic 7.9% |
| Barbadians | 0.0 /100 | #295 | Tragic 7.9% |
| Immigrants | Latin America | 0.0 /100 | #296 | Tragic 7.9% |
| Hispanics or Latinos | 0.0 /100 | #297 | Tragic 7.9% |
| Immigrants | West Indies | 0.0 /100 | #298 | Tragic 7.9% |
| Houma | 0.0 /100 | #299 | Tragic 7.9% |
| Mexicans | 0.0 /100 | #300 | Tragic 8.0% |
| Chippewa | 0.0 /100 | #301 | Tragic 8.0% |
| Immigrants | Ghana | 0.0 /100 | #302 | Tragic 8.0% |
| Immigrants | Bahamas | 0.0 /100 | #303 | Tragic 8.0% |
| Natives/Alaskans | 0.0 /100 | #304 | Tragic 8.0% |
| Colville | 0.0 /100 | #305 | Tragic 8.0% |
| Immigrants | Barbados | 0.0 /100 | #306 | Tragic 8.0% |
| Immigrants | St. Vincent and the Grenadines | 0.0 /100 | #307 | Tragic 8.0% |
Demographics Similar to Laotians by Single Mother Households
In terms of single mother households, the demographic groups most similar to Laotians are South African (5.8%, a difference of 0.11%), Bolivian (5.8%, a difference of 0.18%), Pennsylvania German (5.8%, a difference of 0.25%), Tongan (5.8%, a difference of 0.30%), and Irish (5.8%, a difference of 0.32%).
| Demographics | Rating | Rank | Single Mother Households |
| Immigrants | England | 95.5 /100 | #111 | Exceptional 5.8% |
| Immigrants | Kuwait | 95.4 /100 | #112 | Exceptional 5.8% |
| Mongolians | 95.3 /100 | #113 | Exceptional 5.8% |
| Dutch | 95.1 /100 | #114 | Exceptional 5.8% |
| Irish | 94.8 /100 | #115 | Exceptional 5.8% |
| Pennsylvania Germans | 94.7 /100 | #116 | Exceptional 5.8% |
| Bolivians | 94.6 /100 | #117 | Exceptional 5.8% |
| Laotians | 94.3 /100 | #118 | Exceptional 5.8% |
| South Africans | 94.1 /100 | #119 | Exceptional 5.8% |
| Tongans | 93.7 /100 | #120 | Exceptional 5.8% |
| Argentineans | 93.7 /100 | #121 | Exceptional 5.8% |
| Belgians | 93.5 /100 | #122 | Exceptional 5.8% |
| Immigrants | Uzbekistan | 93.4 /100 | #123 | Exceptional 5.9% |
| Immigrants | Argentina | 93.2 /100 | #124 | Exceptional 5.9% |
| Slavs | 92.9 /100 | #125 | Exceptional 5.9% |