Mexican vs Hungarian Single Mother Households

COMPARE

Mexican
Race
Ancestry
AfghanAfricanAlaska NativeAlaskan AthabascanAlbanianAleutAlsatianAmericanApacheArabArapahoArgentineanArmenianAssyrian/Chaldean/SyriacAustralianAustrianBahamianBangladeshiBarbadianBasqueBelgianBelizeanBermudanBhutaneseBlackfeetBolivianBrazilianBritishBritish West IndianBulgarianBurmeseCajunCambodianCanadianCape VerdeanCarpatho RusynCelticCentral AmericanCentral American IndianCherokeeCheyenneChickasawChileanChineseChippewaChoctawColombianColvilleComancheCosta RicanCreeCreekCroatianCrowCubanCypriotCzechCzechoslovakianDanishDelawareDominicanDutchDutch West IndianEastern EuropeanEcuadorianEgyptianEnglishEstonianEthiopianEuropeanFijianFilipinoFinnishFrenchFrench American IndianFrench CanadianGermanGerman RussianGhanaianGreekGuamanian/ChamorroGuatemalanGuyaneseHaitianHmongHonduranHopiHoumaIcelanderIndian (Asian)IndonesianInupiatIranianIraqiIrishIroquoisIsraeliItalianJamaicanJapaneseJordanianKenyanKiowaKoreanLaotianLatvianLebaneseLiberianLithuanianLumbeeLuxembourgerMacedonianMalaysianMalteseMarshalleseMenomineeMexicanMexican American IndianMongolianMoroccanNative HawaiianNavajoNepaleseNew ZealanderNicaraguanNigerianNorthern EuropeanNorwegianOkinawanOsageOttawaPaiutePakistaniPalestinianPanamanianParaguayanPennsylvania GermanPeruvianPimaPolishPortuguesePotawatomiPuebloPuerto RicanPuget Sound SalishRomanianRussianSalvadoranSamoanScandinavianScotch-IrishScottishSeminoleSenegaleseSerbianShoshoneSierra LeoneanSiouxSlavicSlovakSloveneSomaliSouth AfricanSouth AmericanSouth American IndianSoviet UnionSpaniardSpanishSpanish AmericanSpanish American IndianSri LankanSubsaharan AfricanSudaneseSwedishSwissSyrianTaiwaneseThaiTlingit-HaidaTohono O'OdhamTonganTrinidadian and TobagonianTsimshianTurkishU.S. Virgin IslanderUgandanUkrainianUruguayanUteVenezuelanVietnameseWelshWest IndianYakamaYaquiYugoslavianYumanYup'ikZimbabwean
Immigration
NonimmigrantsImmigrantsAfghanistanAfricaAlbaniaArgentinaArmeniaAsiaAustraliaAustriaBahamasBangladeshBarbadosBelarusBelgiumBelizeBoliviaBosnia and HerzegovinaBrazilBulgariaBurma/MyanmarCabo VerdeCambodiaCameroonCanadaCaribbeanCentral AmericaChileChinaColombiaCongoCosta RicaCroatiaCubaCzechoslovakiaDenmarkDominicaDominican RepublicEastern AfricaEastern AsiaEastern EuropeEcuadorEgyptEl SalvadorEnglandEritreaEthiopiaEuropeFijiFranceGermanyGhanaGreeceGrenadaGuatemalaGuyanaHaitiHondurasHong KongHungaryIndiaIndonesiaIranIraqIrelandIsraelItalyJamaicaJapanJordanKazakhstanKenyaKoreaKuwaitLaosLatin AmericaLatviaLebanonLiberiaLithuaniaMalaysiaMexicoMicronesiaMiddle AfricaMoldovaMoroccoNepalNetherlandsNicaraguaNigeriaNorth AmericaNorth MacedoniaNorthern AfricaNorthern EuropeNorwayOceaniaPakistanPanamaPeruPhilippinesPolandPortugalRomaniaRussiaSaudi ArabiaScotlandSenegalSerbiaSierra LeoneSingaporeSomaliaSouth AfricaSouth AmericaSouth Central AsiaSouth Eastern AsiaSouthern EuropeSpainSri LankaSt. Vincent and the GrenadinesSudanSwedenSwitzerlandSyriaTaiwanThailandTrinidad and TobagoTurkeyUgandaUkraineUruguayUzbekistanVenezuelaVietnamWest IndiesWestern AfricaWestern AsiaWestern EuropeYemenZaireZimbabweAzores
Hungarian
Race
Ancestry
AfghanAfricanAlaska NativeAlaskan AthabascanAlbanianAleutAlsatianAmericanApacheArabArapahoArgentineanArmenianAssyrian/Chaldean/SyriacAustralianAustrianBahamianBangladeshiBarbadianBasqueBelgianBelizeanBermudanBhutaneseBlackfeetBolivianBrazilianBritishBritish West IndianBulgarianBurmeseCajunCambodianCanadianCape VerdeanCarpatho RusynCelticCentral AmericanCentral American IndianCherokeeCheyenneChickasawChileanChineseChippewaChoctawColombianColvilleComancheCosta RicanCreeCreekCroatianCrowCubanCypriotCzechCzechoslovakianDanishDelawareDominicanDutchDutch West IndianEastern EuropeanEcuadorianEgyptianEnglishEstonianEthiopianEuropeanFijianFilipinoFinnishFrenchFrench American IndianFrench CanadianGermanGerman RussianGhanaianGreekGuamanian/ChamorroGuatemalanGuyaneseHaitianHmongHonduranHopiHoumaHungarianIcelanderIndian (Asian)IndonesianInupiatIranianIraqiIrishIroquoisIsraeliItalianJamaicanJapaneseJordanianKenyanKiowaKoreanLaotianLatvianLebaneseLiberianLithuanianLumbeeLuxembourgerMacedonianMalaysianMalteseMarshalleseMenomineeMexican American IndianMongolianMoroccanNative HawaiianNavajoNepaleseNew ZealanderNicaraguanNigerianNorthern EuropeanNorwegianOkinawanOsageOttawaPaiutePakistaniPalestinianPanamanianParaguayanPennsylvania GermanPeruvianPimaPolishPortuguesePotawatomiPuebloPuerto RicanPuget Sound SalishRomanianRussianSalvadoranSamoanScandinavianScotch-IrishScottishSeminoleSenegaleseSerbianShoshoneSierra LeoneanSiouxSlavicSlovakSloveneSomaliSouth AfricanSouth AmericanSouth American IndianSoviet UnionSpaniardSpanishSpanish AmericanSpanish American IndianSri LankanSubsaharan AfricanSudaneseSwedishSwissSyrianTaiwaneseThaiTlingit-HaidaTohono O'OdhamTonganTrinidadian and TobagonianTsimshianTurkishU.S. Virgin IslanderUgandanUkrainianUruguayanUteVenezuelanVietnameseWelshWest IndianYakamaYaquiYugoslavianYumanYup'ikZimbabwean
Immigration
NonimmigrantsImmigrantsAfghanistanAfricaAlbaniaArgentinaArmeniaAsiaAustraliaAustriaBahamasBangladeshBarbadosBelarusBelgiumBelizeBoliviaBosnia and HerzegovinaBrazilBulgariaBurma/MyanmarCabo VerdeCambodiaCameroonCanadaCaribbeanCentral AmericaChileChinaColombiaCongoCosta RicaCroatiaCubaCzechoslovakiaDenmarkDominicaDominican RepublicEastern AfricaEastern AsiaEastern EuropeEcuadorEgyptEl SalvadorEnglandEritreaEthiopiaEuropeFijiFranceGermanyGhanaGreeceGrenadaGuatemalaGuyanaHaitiHondurasHong KongHungaryIndiaIndonesiaIranIraqIrelandIsraelItalyJamaicaJapanJordanKazakhstanKenyaKoreaKuwaitLaosLatin AmericaLatviaLebanonLiberiaLithuaniaMalaysiaMexicoMicronesiaMiddle AfricaMoldovaMoroccoNepalNetherlandsNicaraguaNigeriaNorth AmericaNorth MacedoniaNorthern AfricaNorthern EuropeNorwayOceaniaPakistanPanamaPeruPhilippinesPolandPortugalRomaniaRussiaSaudi ArabiaScotlandSenegalSerbiaSierra LeoneSingaporeSomaliaSouth AfricaSouth AmericaSouth Central AsiaSouth Eastern AsiaSouthern EuropeSpainSri LankaSt. Vincent and the GrenadinesSudanSwedenSwitzerlandSyriaTaiwanThailandTrinidad and TobagoTurkeyUgandaUkraineUruguayUzbekistanVenezuelaVietnamWest IndiesWestern AfricaWestern AsiaWestern EuropeYemenZaireZimbabweAzores
Single Mother Households
Income
Poverty
Unemployment
Labor Participation
Family Structure
Vehicle Availability
Education Level
Disability

Single Mother Households Comparison

Mexicans

Hungarians

Tragic
Exceptional
8.0%
SINGLE MOTHER HOUSEHOLDS
0.0/ 100
METRIC RATING
300th/ 347
METRIC RANK
5.7%
SINGLE MOTHER HOUSEHOLDS
97.6/ 100
METRIC RATING
85th/ 347
METRIC RANK

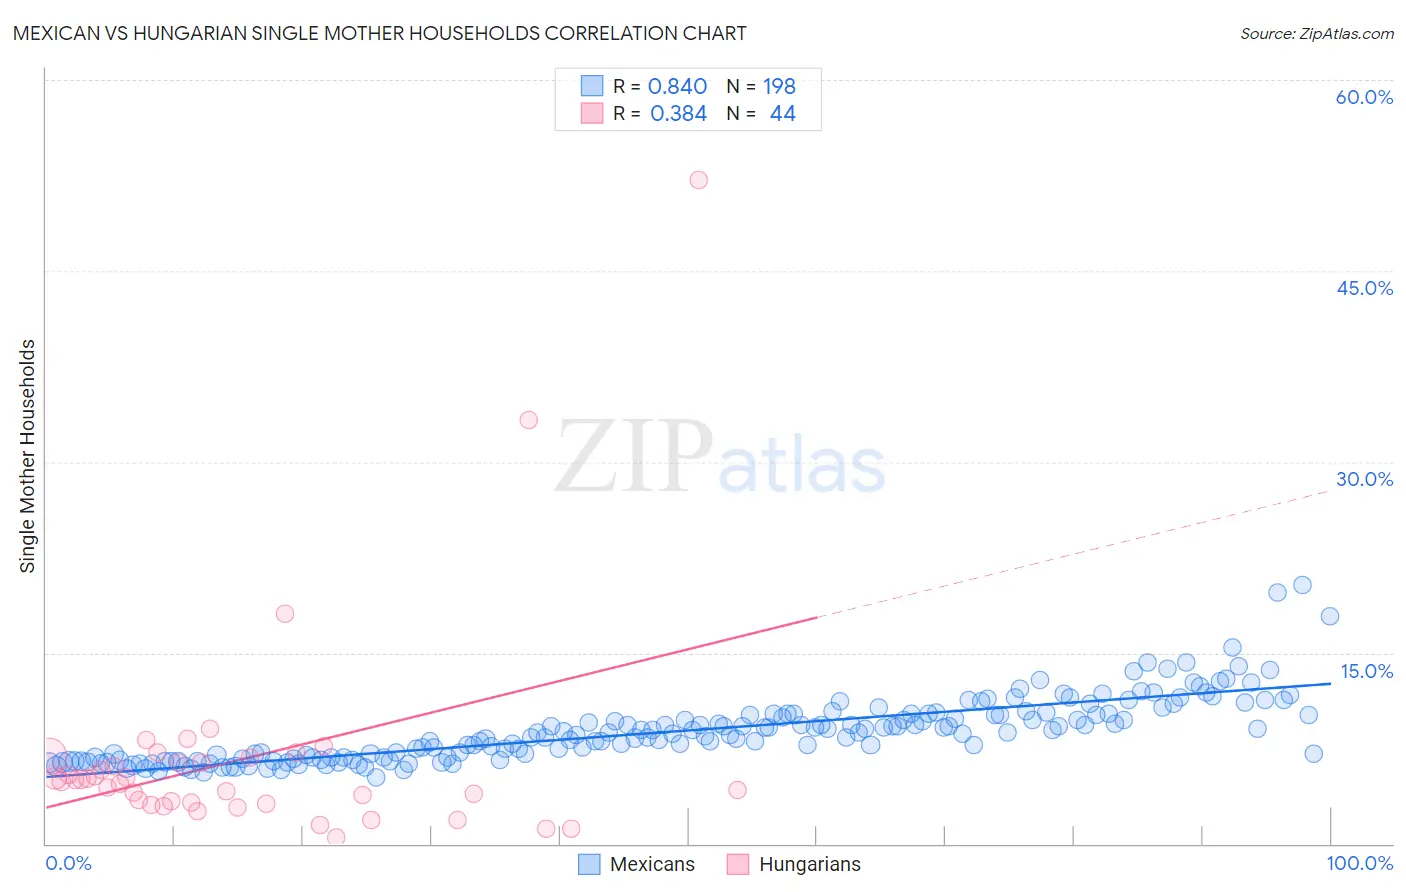
Mexican vs Hungarian Single Mother Households Correlation Chart

The statistical analysis conducted on geographies consisting of 560,737,784 people shows a very strong positive correlation between the proportion of Mexicans and percentage of single mother households in the United States with a correlation coefficient (R) of 0.840 and weighted average of 8.0%. Similarly, the statistical analysis conducted on geographies consisting of 483,597,168 people shows a mild positive correlation between the proportion of Hungarians and percentage of single mother households in the United States with a correlation coefficient (R) of 0.384 and weighted average of 5.7%, a difference of 40.4%.
Mexican vs Hungarian Single Mother Households

Single Mother Households Correlation Summary

MeasurementMexicanHungarian
Minimum5.2%0.48%
Maximum20.4%52.2%
Range15.2%51.7%
Mean8.9%6.6%
Median8.7%4.9%
Interquartile 25% (IQ1)6.8%3.2%
Interquartile 75% (IQ3)10.1%6.6%
Interquartile Range (IQR)3.4%3.4%
Standard Deviation (Sample)2.5%8.7%
Standard Deviation (Population)2.5%8.6%

Similar Demographics by Single Mother Households

Demographics Similar to Mexicans by Single Mother Households

In terms of single mother households, the demographic groups most similar to Mexicans are Chippewa (8.0%, a difference of 0.16%), Immigrants from Ghana (8.0%, a difference of 0.25%), Immigrants from Bahamas (8.0%, a difference of 0.27%), Houma (7.9%, a difference of 0.46%), and Immigrants from West Indies (7.9%, a difference of 0.54%).
DemographicsRating | RankSingle Mother Households
Immigrants | Cameroon
0.0
/100
|
#293
Tragic
7.9%
Apache
0.0
/100
|
#294
Tragic
7.9%
Barbadians
0.0
/100
|
#295
Tragic
7.9%
Immigrants | Latin America
0.0
/100
|
#296
Tragic
7.9%
Hispanics or Latinos
0.0
/100
|
#297
Tragic
7.9%
Immigrants | West Indies
0.0
/100
|
#298
Tragic
7.9%
Houma
0.0
/100
|
#299
Tragic
7.9%
Mexicans
0.0
/100
|
#300
Tragic
8.0%
Chippewa
0.0
/100
|
#301
Tragic
8.0%
Immigrants | Ghana
0.0
/100
|
#302
Tragic
8.0%
Immigrants | Bahamas
0.0
/100
|
#303
Tragic
8.0%
Natives/Alaskans
0.0
/100
|
#304
Tragic
8.0%
Colville
0.0
/100
|
#305
Tragic
8.0%
Immigrants | Barbados
0.0
/100
|
#306
Tragic
8.0%
Immigrants | St. Vincent and the Grenadines
0.0
/100
|
#307
Tragic
8.0%

Demographics Similar to Hungarians by Single Mother Households

In terms of single mother households, the demographic groups most similar to Hungarians are Finnish (5.7%, a difference of 0.030%), Immigrants from Turkey (5.7%, a difference of 0.11%), Carpatho Rusyn (5.7%, a difference of 0.15%), Israeli (5.7%, a difference of 0.18%), and Immigrants from Hungary (5.7%, a difference of 0.23%).
DemographicsRating | RankSingle Mother Households
Swiss
98.1
/100
|
#78
Exceptional
5.6%
Immigrants | Sri Lanka
98.0
/100
|
#79
Exceptional
5.6%
Czechs
97.9
/100
|
#80
Exceptional
5.6%
Immigrants | Moldova
97.9
/100
|
#81
Exceptional
5.6%
Immigrants | Malaysia
97.8
/100
|
#82
Exceptional
5.7%
Immigrants | Hungary
97.8
/100
|
#83
Exceptional
5.7%
Carpatho Rusyns
97.7
/100
|
#84
Exceptional
5.7%
Hungarians
97.6
/100
|
#85
Exceptional
5.7%
Finns
97.6
/100
|
#86
Exceptional
5.7%
Immigrants | Turkey
97.5
/100
|
#87
Exceptional
5.7%
Israelis
97.4
/100
|
#88
Exceptional
5.7%
Ukrainians
97.2
/100
|
#89
Exceptional
5.7%
Immigrants | Indonesia
97.2
/100
|
#90
Exceptional
5.7%
Europeans
97.0
/100
|
#91
Exceptional
5.7%
Immigrants | Western Asia
96.7
/100
|
#92
Exceptional
5.7%