Macedonian vs Immigrants from Dominican Republic Currently Married
COMPARE
Macedonian
Immigrants from Dominican Republic
Currently Married
Currently Married Comparison
Macedonians
Immigrants from Dominican Republic
48.3%
CURRENTLY MARRIED
97.9/ 100
METRIC RATING
71st/ 347
METRIC RANK
38.9%
CURRENTLY MARRIED
0.0/ 100
METRIC RATING
342nd/ 347
METRIC RANK
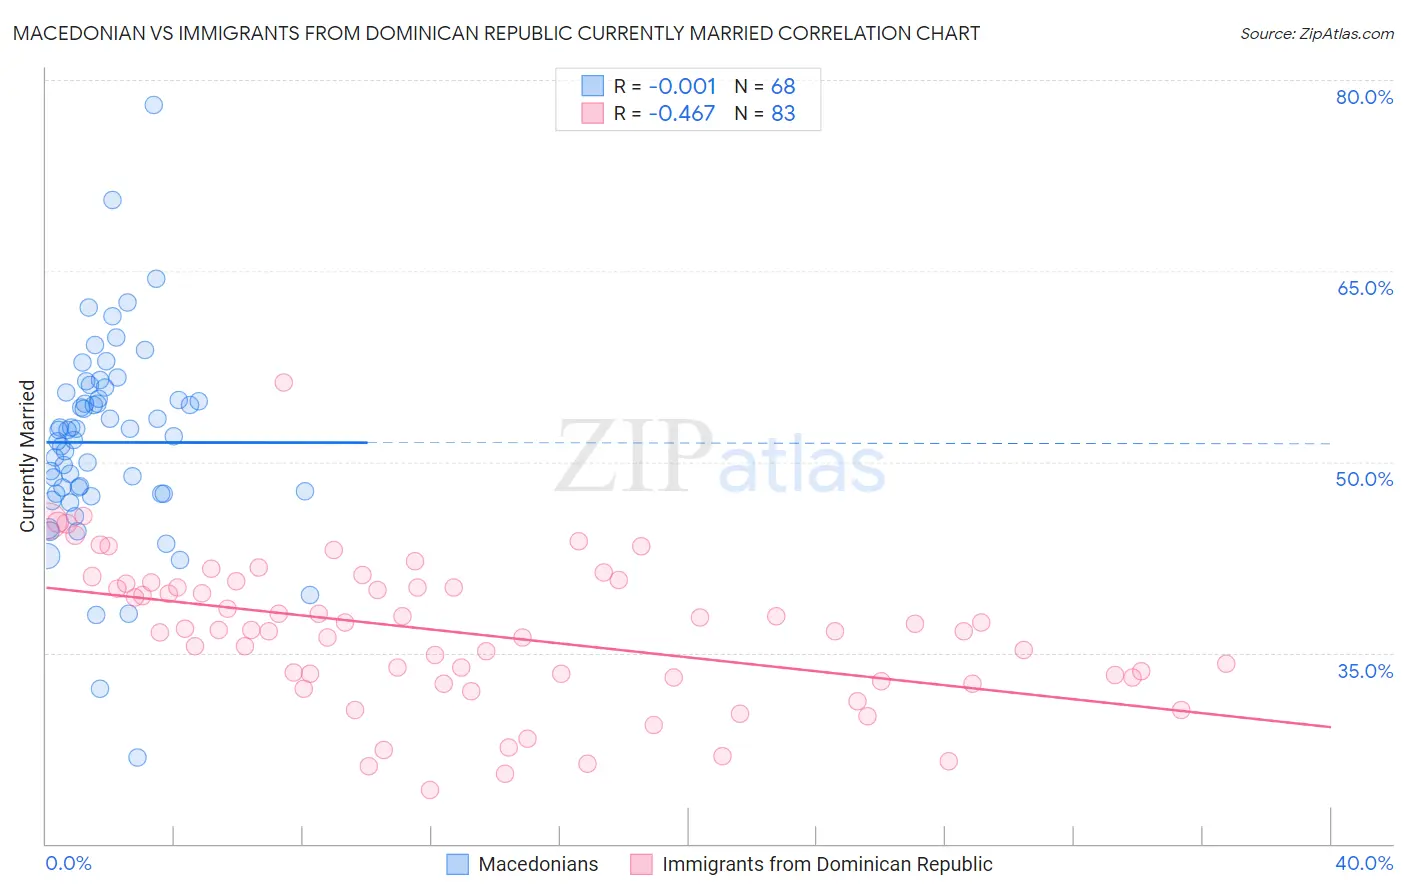
Macedonian vs Immigrants from Dominican Republic Currently Married Correlation Chart
The statistical analysis conducted on geographies consisting of 132,654,492 people shows no correlation between the proportion of Macedonians and percentage of population currently married in the United States with a correlation coefficient (R) of -0.001 and weighted average of 48.3%. Similarly, the statistical analysis conducted on geographies consisting of 275,115,550 people shows a moderate negative correlation between the proportion of Immigrants from Dominican Republic and percentage of population currently married in the United States with a correlation coefficient (R) of -0.467 and weighted average of 38.9%, a difference of 24.0%.
Currently Married Correlation Summary
| Measurement | Macedonian | Immigrants from Dominican Republic |
| Minimum | 26.8% | 24.2% |
| Maximum | 78.0% | 56.2% |
| Range | 51.2% | 32.0% |
| Mean | 51.5% | 36.5% |
| Median | 52.3% | 36.8% |
| Interquartile 25% (IQ1) | 47.5% | 33.0% |
| Interquartile 75% (IQ3) | 55.2% | 40.5% |
| Interquartile Range (IQR) | 7.7% | 7.4% |
| Standard Deviation (Sample) | 7.9% | 5.7% |
| Standard Deviation (Population) | 7.8% | 5.7% |
Similar Demographics by Currently Married
Demographics Similar to Macedonians by Currently Married
In terms of currently married, the demographic groups most similar to Macedonians are Immigrants from Asia (48.3%, a difference of 0.010%), Canadian (48.3%, a difference of 0.090%), Immigrants from England (48.3%, a difference of 0.11%), Slovak (48.3%, a difference of 0.12%), and Tongan (48.3%, a difference of 0.13%).
| Demographics | Rating | Rank | Currently Married |
| Immigrants | Czechoslovakia | 98.3 /100 | #64 | Exceptional 48.4% |
| Ukrainians | 98.3 /100 | #65 | Exceptional 48.4% |
| Tongans | 98.2 /100 | #66 | Exceptional 48.3% |
| Slovaks | 98.2 /100 | #67 | Exceptional 48.3% |
| Immigrants | England | 98.2 /100 | #68 | Exceptional 48.3% |
| Canadians | 98.1 /100 | #69 | Exceptional 48.3% |
| Immigrants | Asia | 97.9 /100 | #70 | Exceptional 48.3% |
| Macedonians | 97.9 /100 | #71 | Exceptional 48.3% |
| Immigrants | Lebanon | 97.6 /100 | #72 | Exceptional 48.2% |
| Immigrants | Eastern Asia | 97.5 /100 | #73 | Exceptional 48.2% |
| Estonians | 97.4 /100 | #74 | Exceptional 48.2% |
| Immigrants | Belarus | 97.2 /100 | #75 | Exceptional 48.1% |
| Basques | 97.2 /100 | #76 | Exceptional 48.1% |
| Slovenes | 97.1 /100 | #77 | Exceptional 48.1% |
| Immigrants | Belgium | 97.1 /100 | #78 | Exceptional 48.1% |
Demographics Similar to Immigrants from Dominican Republic by Currently Married
In terms of currently married, the demographic groups most similar to Immigrants from Dominican Republic are Navajo (39.0%, a difference of 0.17%), Immigrants from Grenada (39.1%, a difference of 0.52%), Dominican (39.5%, a difference of 1.5%), Cape Verdean (39.6%, a difference of 1.6%), and Black/African American (39.6%, a difference of 1.7%).
| Demographics | Rating | Rank | Currently Married |
| Yup'ik | 0.0 /100 | #333 | Tragic 39.9% |
| Puerto Ricans | 0.0 /100 | #334 | Tragic 39.9% |
| Lumbee | 0.0 /100 | #335 | Tragic 39.8% |
| British West Indians | 0.0 /100 | #336 | Tragic 39.8% |
| Blacks/African Americans | 0.0 /100 | #337 | Tragic 39.6% |
| Cape Verdeans | 0.0 /100 | #338 | Tragic 39.6% |
| Dominicans | 0.0 /100 | #339 | Tragic 39.5% |
| Immigrants | Grenada | 0.0 /100 | #340 | Tragic 39.1% |
| Navajo | 0.0 /100 | #341 | Tragic 39.0% |
| Immigrants | Dominican Republic | 0.0 /100 | #342 | Tragic 38.9% |
| Pueblo | 0.0 /100 | #343 | Tragic 38.2% |
| Immigrants | Cabo Verde | 0.0 /100 | #344 | Tragic 37.8% |
| Tohono O'odham | 0.0 /100 | #345 | Tragic 36.8% |
| Hopi | 0.0 /100 | #346 | Tragic 36.5% |
| Pima | 0.0 /100 | #347 | Tragic 35.9% |