Macedonian vs Immigrants from China Currently Married
COMPARE
Macedonian
Immigrants from China
Currently Married
Currently Married Comparison
Macedonians
Immigrants from China
48.3%
CURRENTLY MARRIED
97.9/ 100
METRIC RATING
71st/ 347
METRIC RANK
47.9%
CURRENTLY MARRIED
94.7/ 100
METRIC RATING
98th/ 347
METRIC RANK
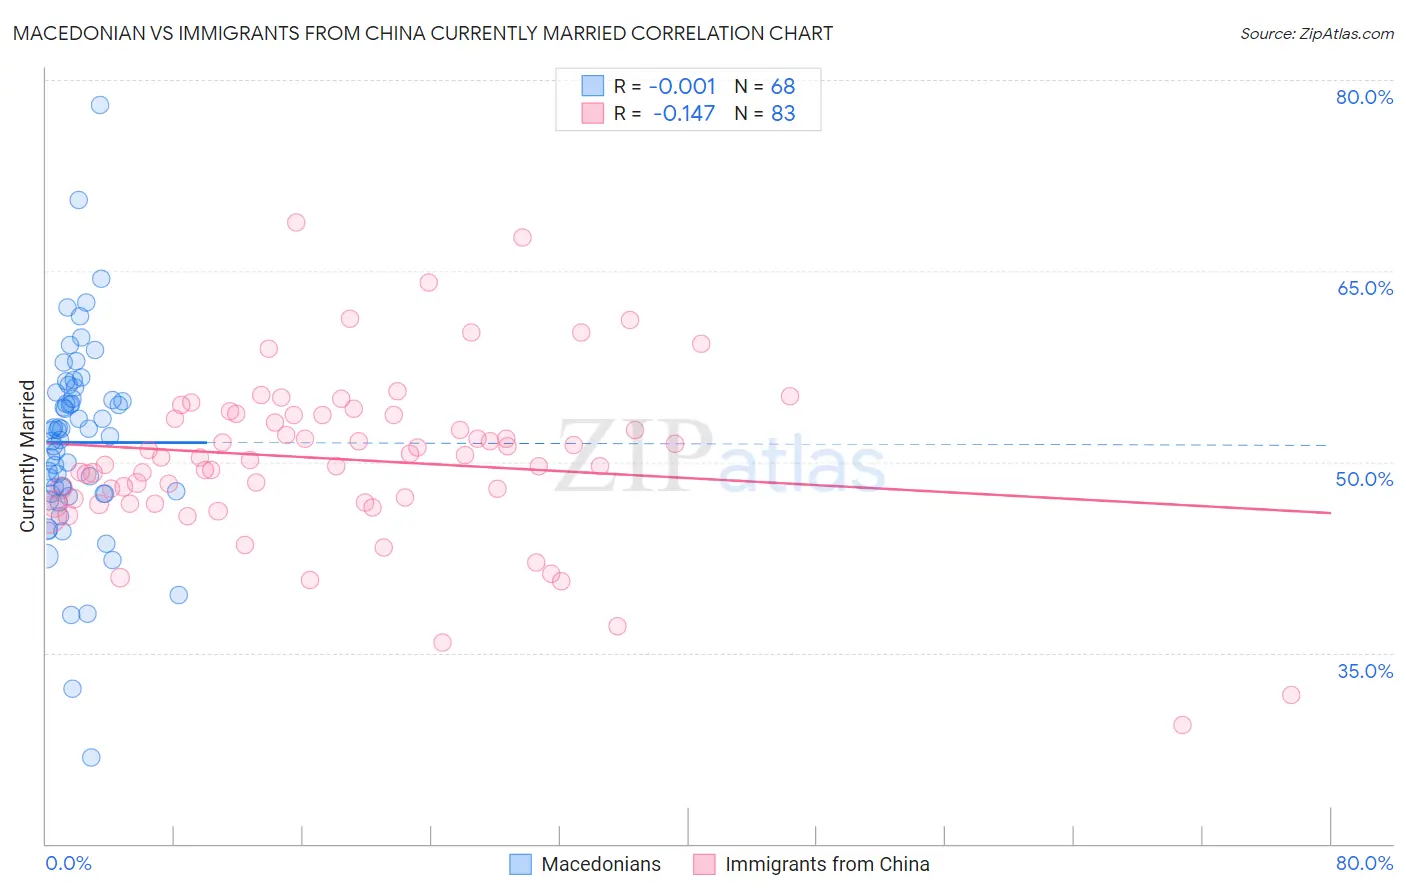
Macedonian vs Immigrants from China Currently Married Correlation Chart
The statistical analysis conducted on geographies consisting of 132,654,492 people shows no correlation between the proportion of Macedonians and percentage of population currently married in the United States with a correlation coefficient (R) of -0.001 and weighted average of 48.3%. Similarly, the statistical analysis conducted on geographies consisting of 456,988,820 people shows a poor negative correlation between the proportion of Immigrants from China and percentage of population currently married in the United States with a correlation coefficient (R) of -0.147 and weighted average of 47.9%, a difference of 0.86%.
Currently Married Correlation Summary
| Measurement | Macedonian | Immigrants from China |
| Minimum | 26.8% | 29.3% |
| Maximum | 78.0% | 68.8% |
| Range | 51.2% | 39.5% |
| Mean | 51.5% | 50.2% |
| Median | 52.3% | 50.3% |
| Interquartile 25% (IQ1) | 47.5% | 46.8% |
| Interquartile 75% (IQ3) | 55.2% | 53.7% |
| Interquartile Range (IQR) | 7.7% | 6.9% |
| Standard Deviation (Sample) | 7.9% | 6.6% |
| Standard Deviation (Population) | 7.8% | 6.6% |
Similar Demographics by Currently Married
Demographics Similar to Macedonians by Currently Married
In terms of currently married, the demographic groups most similar to Macedonians are Immigrants from Asia (48.3%, a difference of 0.010%), Canadian (48.3%, a difference of 0.090%), Immigrants from England (48.3%, a difference of 0.11%), Slovak (48.3%, a difference of 0.12%), and Tongan (48.3%, a difference of 0.13%).
| Demographics | Rating | Rank | Currently Married |
| Immigrants | Czechoslovakia | 98.3 /100 | #64 | Exceptional 48.4% |
| Ukrainians | 98.3 /100 | #65 | Exceptional 48.4% |
| Tongans | 98.2 /100 | #66 | Exceptional 48.3% |
| Slovaks | 98.2 /100 | #67 | Exceptional 48.3% |
| Immigrants | England | 98.2 /100 | #68 | Exceptional 48.3% |
| Canadians | 98.1 /100 | #69 | Exceptional 48.3% |
| Immigrants | Asia | 97.9 /100 | #70 | Exceptional 48.3% |
| Macedonians | 97.9 /100 | #71 | Exceptional 48.3% |
| Immigrants | Lebanon | 97.6 /100 | #72 | Exceptional 48.2% |
| Immigrants | Eastern Asia | 97.5 /100 | #73 | Exceptional 48.2% |
| Estonians | 97.4 /100 | #74 | Exceptional 48.2% |
| Immigrants | Belarus | 97.2 /100 | #75 | Exceptional 48.1% |
| Basques | 97.2 /100 | #76 | Exceptional 48.1% |
| Slovenes | 97.1 /100 | #77 | Exceptional 48.1% |
| Immigrants | Belgium | 97.1 /100 | #78 | Exceptional 48.1% |
Demographics Similar to Immigrants from China by Currently Married
In terms of currently married, the demographic groups most similar to Immigrants from China are Immigrants from Bulgaria (47.9%, a difference of 0.020%), Egyptian (47.9%, a difference of 0.020%), Immigrants from Ukraine (47.9%, a difference of 0.020%), Native Hawaiian (47.9%, a difference of 0.060%), and Lebanese (47.9%, a difference of 0.070%).
| Demographics | Rating | Rank | Currently Married |
| Immigrants | Bolivia | 95.6 /100 | #91 | Exceptional 47.9% |
| Koreans | 95.4 /100 | #92 | Exceptional 47.9% |
| Lebanese | 95.1 /100 | #93 | Exceptional 47.9% |
| Native Hawaiians | 95.0 /100 | #94 | Exceptional 47.9% |
| Immigrants | Bulgaria | 94.8 /100 | #95 | Exceptional 47.9% |
| Egyptians | 94.8 /100 | #96 | Exceptional 47.9% |
| Immigrants | Ukraine | 94.8 /100 | #97 | Exceptional 47.9% |
| Immigrants | China | 94.7 /100 | #98 | Exceptional 47.9% |
| Immigrants | Sweden | 94.3 /100 | #99 | Exceptional 47.8% |
| Celtics | 94.2 /100 | #100 | Exceptional 47.8% |
| Immigrants | Germany | 94.1 /100 | #101 | Exceptional 47.8% |
| Turks | 93.9 /100 | #102 | Exceptional 47.8% |
| Cypriots | 93.7 /100 | #103 | Exceptional 47.8% |
| Serbians | 93.6 /100 | #104 | Exceptional 47.8% |
| Immigrants | Singapore | 93.3 /100 | #105 | Exceptional 47.8% |