Luxembourger vs Immigrants from India Family Households
COMPARE
Luxembourger
Immigrants from India
Family Households
Family Households Comparison
Luxembourgers
Immigrants from India
63.3%
FAMILY HOUSEHOLDS
0.9/ 100
METRIC RATING
256th/ 347
METRIC RANK
67.4%
FAMILY HOUSEHOLDS
100.0/ 100
METRIC RATING
26th/ 347
METRIC RANK
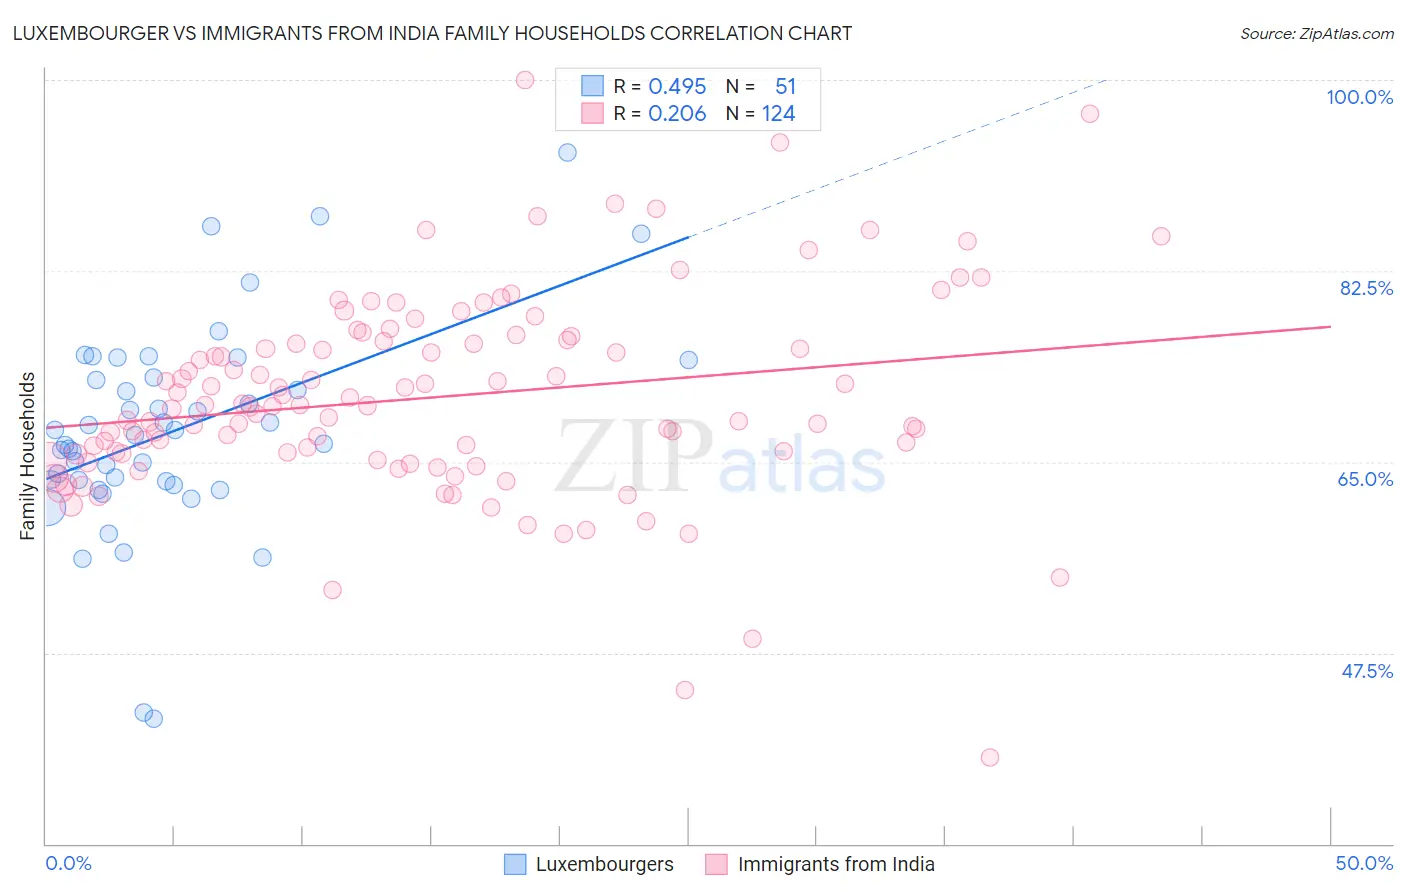
Luxembourger vs Immigrants from India Family Households Correlation Chart
The statistical analysis conducted on geographies consisting of 144,654,456 people shows a moderate positive correlation between the proportion of Luxembourgers and percentage of family households in the United States with a correlation coefficient (R) of 0.495 and weighted average of 63.3%. Similarly, the statistical analysis conducted on geographies consisting of 433,768,337 people shows a weak positive correlation between the proportion of Immigrants from India and percentage of family households in the United States with a correlation coefficient (R) of 0.206 and weighted average of 67.4%, a difference of 6.6%.
Family Households Correlation Summary
| Measurement | Luxembourger | Immigrants from India |
| Minimum | 41.4% | 37.9% |
| Maximum | 93.3% | 100.0% |
| Range | 51.9% | 62.1% |
| Mean | 67.9% | 70.9% |
| Median | 67.5% | 70.2% |
| Interquartile 25% (IQ1) | 63.2% | 65.7% |
| Interquartile 75% (IQ3) | 72.7% | 76.1% |
| Interquartile Range (IQR) | 9.5% | 10.4% |
| Standard Deviation (Sample) | 9.5% | 9.4% |
| Standard Deviation (Population) | 9.4% | 9.4% |
Similar Demographics by Family Households
Demographics Similar to Luxembourgers by Family Households
In terms of family households, the demographic groups most similar to Luxembourgers are Potawatomi (63.3%, a difference of 0.020%), Icelander (63.3%, a difference of 0.040%), Immigrants from Dominican Republic (63.3%, a difference of 0.050%), Slovak (63.3%, a difference of 0.050%), and Bahamian (63.3%, a difference of 0.080%).
| Demographics | Rating | Rank | Family Households |
| Russians | 1.4 /100 | #249 | Tragic 63.4% |
| Immigrants | Japan | 1.4 /100 | #250 | Tragic 63.4% |
| Taiwanese | 1.2 /100 | #251 | Tragic 63.3% |
| Bahamians | 1.1 /100 | #252 | Tragic 63.3% |
| Immigrants | Dominican Republic | 1.0 /100 | #253 | Tragic 63.3% |
| Slovaks | 1.0 /100 | #254 | Tragic 63.3% |
| Potawatomi | 1.0 /100 | #255 | Tragic 63.3% |
| Luxembourgers | 0.9 /100 | #256 | Tragic 63.3% |
| Icelanders | 0.8 /100 | #257 | Tragic 63.3% |
| Immigrants | Barbados | 0.7 /100 | #258 | Tragic 63.2% |
| Immigrants | Western Europe | 0.6 /100 | #259 | Tragic 63.2% |
| Cypriots | 0.6 /100 | #260 | Tragic 63.2% |
| Immigrants | Russia | 0.6 /100 | #261 | Tragic 63.2% |
| Immigrants | Ireland | 0.6 /100 | #262 | Tragic 63.2% |
| Cheyenne | 0.5 /100 | #263 | Tragic 63.2% |
Demographics Similar to Immigrants from India by Family Households
In terms of family households, the demographic groups most similar to Immigrants from India are Immigrants from Nicaragua (67.5%, a difference of 0.010%), Immigrants from South Eastern Asia (67.5%, a difference of 0.040%), Hispanic or Latino (67.4%, a difference of 0.040%), Hawaiian (67.4%, a difference of 0.060%), and Nicaraguan (67.4%, a difference of 0.13%).
| Demographics | Rating | Rank | Family Households |
| Samoans | 100.0 /100 | #19 | Exceptional 67.9% |
| Inupiat | 100.0 /100 | #20 | Exceptional 67.8% |
| Cubans | 100.0 /100 | #21 | Exceptional 67.7% |
| Sri Lankans | 100.0 /100 | #22 | Exceptional 67.7% |
| Immigrants | Pakistan | 100.0 /100 | #23 | Exceptional 67.7% |
| Immigrants | South Eastern Asia | 100.0 /100 | #24 | Exceptional 67.5% |
| Immigrants | Nicaragua | 100.0 /100 | #25 | Exceptional 67.5% |
| Immigrants | India | 100.0 /100 | #26 | Exceptional 67.4% |
| Hispanics or Latinos | 100.0 /100 | #27 | Exceptional 67.4% |
| Hawaiians | 100.0 /100 | #28 | Exceptional 67.4% |
| Nicaraguans | 100.0 /100 | #29 | Exceptional 67.4% |
| Immigrants | Peru | 100.0 /100 | #30 | Exceptional 67.2% |
| Immigrants | Latin America | 100.0 /100 | #31 | Exceptional 67.2% |
| Nepalese | 100.0 /100 | #32 | Exceptional 67.2% |
| Salvadorans | 100.0 /100 | #33 | Exceptional 67.2% |