Liberian vs Immigrants from Eastern Asia Family Households
COMPARE
Liberian
Immigrants from Eastern Asia
Family Households
Family Households Comparison
Liberians
Immigrants from Eastern Asia
62.0%
FAMILY HOUSEHOLDS
0.0/ 100
METRIC RATING
313th/ 347
METRIC RANK
64.9%
FAMILY HOUSEHOLDS
94.4/ 100
METRIC RATING
119th/ 347
METRIC RANK
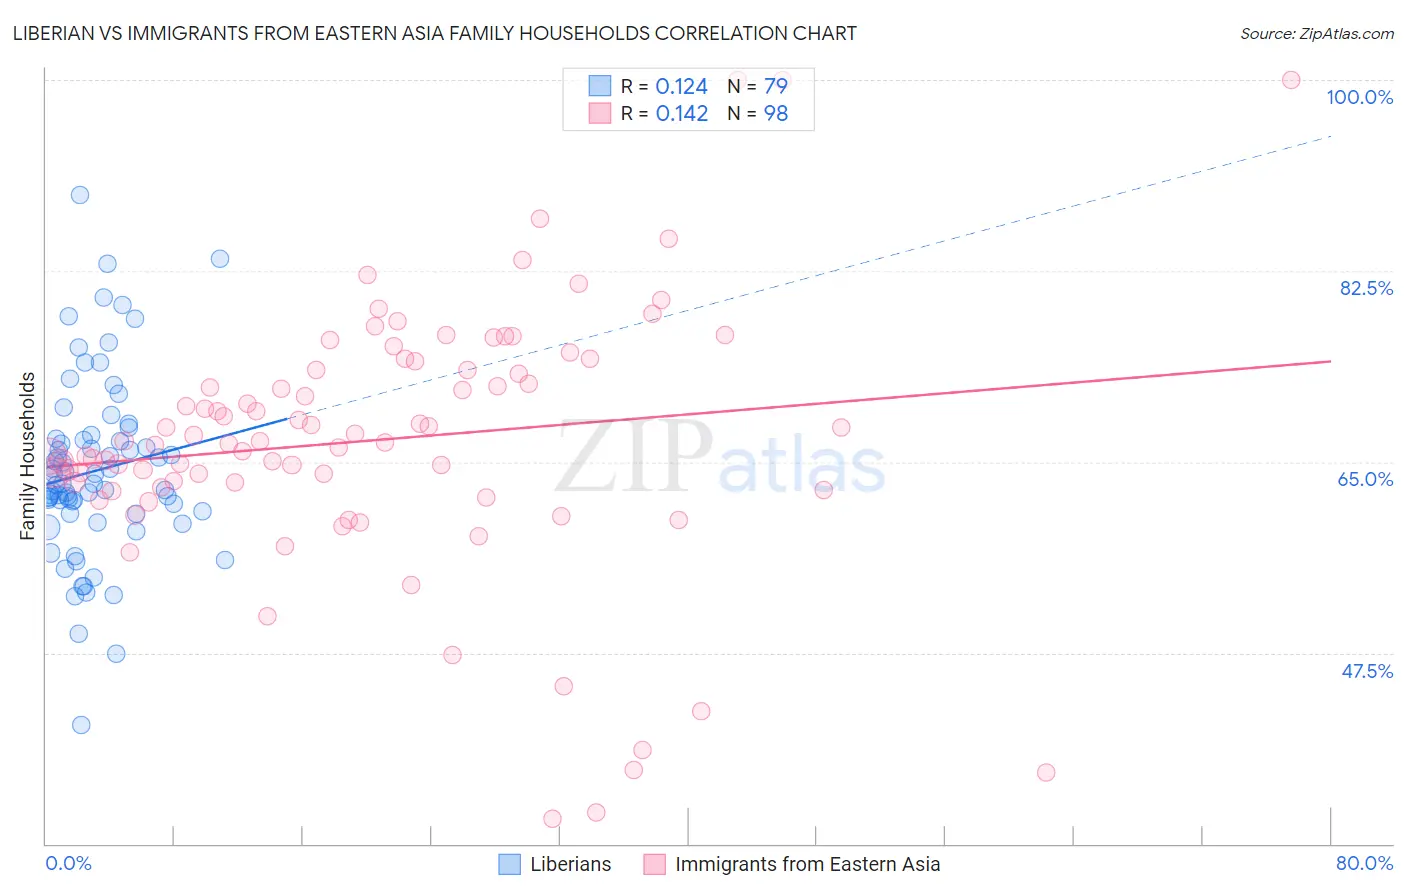
Liberian vs Immigrants from Eastern Asia Family Households Correlation Chart
The statistical analysis conducted on geographies consisting of 118,040,608 people shows a poor positive correlation between the proportion of Liberians and percentage of family households in the United States with a correlation coefficient (R) of 0.124 and weighted average of 62.0%. Similarly, the statistical analysis conducted on geographies consisting of 499,398,554 people shows a poor positive correlation between the proportion of Immigrants from Eastern Asia and percentage of family households in the United States with a correlation coefficient (R) of 0.142 and weighted average of 64.9%, a difference of 4.7%.
Family Households Correlation Summary
| Measurement | Liberian | Immigrants from Eastern Asia |
| Minimum | 40.9% | 32.3% |
| Maximum | 89.4% | 100.0% |
| Range | 48.5% | 67.7% |
| Mean | 64.2% | 67.0% |
| Median | 63.0% | 66.8% |
| Interquartile 25% (IQ1) | 60.3% | 62.7% |
| Interquartile 75% (IQ3) | 67.1% | 73.5% |
| Interquartile Range (IQR) | 6.8% | 10.8% |
| Standard Deviation (Sample) | 8.3% | 12.2% |
| Standard Deviation (Population) | 8.3% | 12.1% |
Similar Demographics by Family Households
Demographics Similar to Liberians by Family Households
In terms of family households, the demographic groups most similar to Liberians are Immigrants from Latvia (62.0%, a difference of 0.010%), Immigrants from Morocco (62.0%, a difference of 0.050%), Immigrants from Cabo Verde (61.9%, a difference of 0.050%), Immigrants from Liberia (62.0%, a difference of 0.080%), and Moroccan (61.9%, a difference of 0.090%).
| Demographics | Rating | Rank | Family Households |
| Africans | 0.0 /100 | #306 | Tragic 62.1% |
| Immigrants | Norway | 0.0 /100 | #307 | Tragic 62.1% |
| Chippewa | 0.0 /100 | #308 | Tragic 62.1% |
| Sub-Saharan Africans | 0.0 /100 | #309 | Tragic 62.1% |
| Immigrants | Liberia | 0.0 /100 | #310 | Tragic 62.0% |
| Immigrants | Morocco | 0.0 /100 | #311 | Tragic 62.0% |
| Immigrants | Latvia | 0.0 /100 | #312 | Tragic 62.0% |
| Liberians | 0.0 /100 | #313 | Tragic 62.0% |
| Immigrants | Cabo Verde | 0.0 /100 | #314 | Tragic 61.9% |
| Moroccans | 0.0 /100 | #315 | Tragic 61.9% |
| Immigrants | Middle Africa | 0.0 /100 | #316 | Tragic 61.9% |
| Immigrants | Bosnia and Herzegovina | 0.0 /100 | #317 | Tragic 61.9% |
| Alaskan Athabascans | 0.0 /100 | #318 | Tragic 61.8% |
| Cape Verdeans | 0.0 /100 | #319 | Tragic 61.8% |
| Ugandans | 0.0 /100 | #320 | Tragic 61.7% |
Demographics Similar to Immigrants from Eastern Asia by Family Households
In terms of family households, the demographic groups most similar to Immigrants from Eastern Asia are Immigrants from Oceania (64.9%, a difference of 0.010%), Hungarian (64.9%, a difference of 0.020%), Dutch (64.9%, a difference of 0.040%), Cherokee (65.0%, a difference of 0.060%), and Hmong (64.9%, a difference of 0.060%).
| Demographics | Rating | Rank | Family Households |
| Immigrants | Jordan | 96.5 /100 | #112 | Exceptional 65.0% |
| Spanish | 96.2 /100 | #113 | Exceptional 65.0% |
| Argentineans | 95.7 /100 | #114 | Exceptional 65.0% |
| Ecuadorians | 95.4 /100 | #115 | Exceptional 65.0% |
| Immigrants | Iraq | 95.4 /100 | #116 | Exceptional 65.0% |
| Cherokee | 95.3 /100 | #117 | Exceptional 65.0% |
| Dutch | 95.1 /100 | #118 | Exceptional 64.9% |
| Immigrants | Eastern Asia | 94.4 /100 | #119 | Exceptional 64.9% |
| Immigrants | Oceania | 94.2 /100 | #120 | Exceptional 64.9% |
| Hungarians | 94.0 /100 | #121 | Exceptional 64.9% |
| Hmong | 93.4 /100 | #122 | Exceptional 64.9% |
| Choctaw | 93.4 /100 | #123 | Exceptional 64.9% |
| Immigrants | Argentina | 92.8 /100 | #124 | Exceptional 64.9% |
| Immigrants | Belize | 92.7 /100 | #125 | Exceptional 64.9% |
| Panamanians | 92.4 /100 | #126 | Exceptional 64.8% |