Latvian vs Spaniard Single Father Households
COMPARE
Latvian
Spaniard
Single Father Households
Single Father Households Comparison
Latvians
Spaniards
2.0%
SINGLE FATHER HOUSEHOLDS
100.0/ 100
METRIC RATING
44th/ 347
METRIC RANK
2.5%
SINGLE FATHER HOUSEHOLDS
3.1/ 100
METRIC RATING
243rd/ 347
METRIC RANK
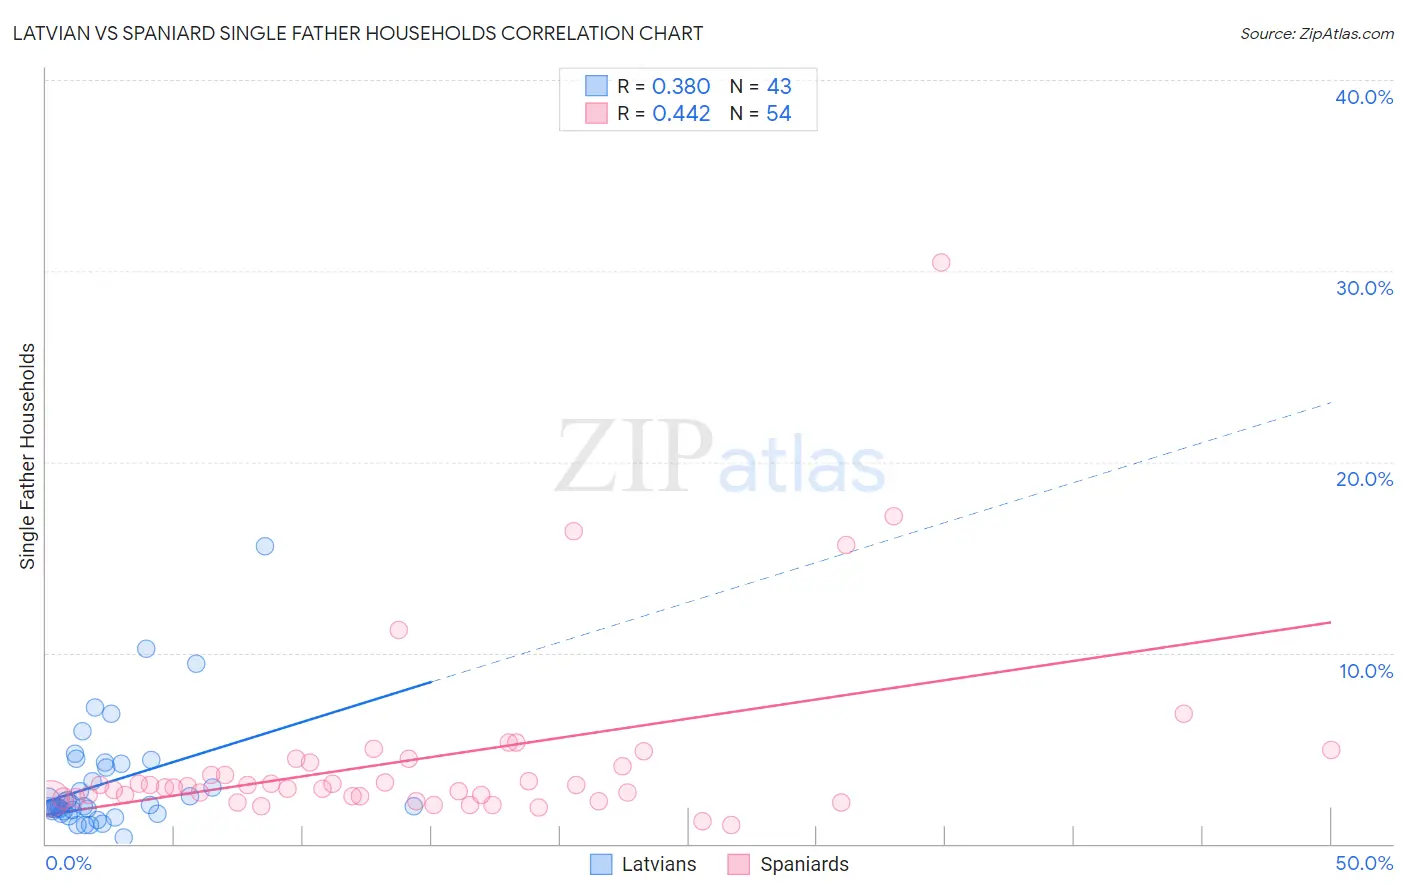
Latvian vs Spaniard Single Father Households Correlation Chart
The statistical analysis conducted on geographies consisting of 219,307,286 people shows a mild positive correlation between the proportion of Latvians and percentage of single father households in the United States with a correlation coefficient (R) of 0.380 and weighted average of 2.0%. Similarly, the statistical analysis conducted on geographies consisting of 438,543,762 people shows a moderate positive correlation between the proportion of Spaniards and percentage of single father households in the United States with a correlation coefficient (R) of 0.442 and weighted average of 2.5%, a difference of 23.9%.
Single Father Households Correlation Summary
| Measurement | Latvian | Spaniard |
| Minimum | 0.31% | 1.0% |
| Maximum | 15.6% | 30.4% |
| Range | 15.2% | 29.4% |
| Mean | 3.2% | 4.5% |
| Median | 2.0% | 3.0% |
| Interquartile 25% (IQ1) | 1.7% | 2.4% |
| Interquartile 75% (IQ3) | 4.2% | 4.2% |
| Interquartile Range (IQR) | 2.5% | 1.8% |
| Standard Deviation (Sample) | 2.9% | 5.0% |
| Standard Deviation (Population) | 2.9% | 4.9% |
Similar Demographics by Single Father Households
Demographics Similar to Latvians by Single Father Households
In terms of single father households, the demographic groups most similar to Latvians are Russian (2.0%, a difference of 0.020%), Immigrants from Grenada (2.0%, a difference of 0.090%), Immigrants from Lebanon (2.0%, a difference of 0.12%), Macedonian (2.0%, a difference of 0.31%), and Immigrants from Turkey (2.0%, a difference of 0.46%).
| Demographics | Rating | Rank | Single Father Households |
| Immigrants | St. Vincent and the Grenadines | 100.0 /100 | #37 | Exceptional 2.0% |
| Immigrants | Eastern Europe | 100.0 /100 | #38 | Exceptional 2.0% |
| Immigrants | Sri Lanka | 100.0 /100 | #39 | Exceptional 2.0% |
| Immigrants | Bulgaria | 100.0 /100 | #40 | Exceptional 2.0% |
| Immigrants | Turkey | 100.0 /100 | #41 | Exceptional 2.0% |
| Macedonians | 100.0 /100 | #42 | Exceptional 2.0% |
| Immigrants | Grenada | 100.0 /100 | #43 | Exceptional 2.0% |
| Latvians | 100.0 /100 | #44 | Exceptional 2.0% |
| Russians | 100.0 /100 | #45 | Exceptional 2.0% |
| Immigrants | Lebanon | 100.0 /100 | #46 | Exceptional 2.0% |
| Immigrants | Ukraine | 99.9 /100 | #47 | Exceptional 2.0% |
| Immigrants | Kazakhstan | 99.9 /100 | #48 | Exceptional 2.0% |
| Immigrants | Serbia | 99.9 /100 | #49 | Exceptional 2.0% |
| Immigrants | Switzerland | 99.9 /100 | #50 | Exceptional 2.0% |
| Immigrants | Poland | 99.9 /100 | #51 | Exceptional 2.0% |
Demographics Similar to Spaniards by Single Father Households
In terms of single father households, the demographic groups most similar to Spaniards are Immigrants from Middle Africa (2.5%, a difference of 0.19%), Basque (2.5%, a difference of 0.39%), Native Hawaiian (2.5%, a difference of 0.41%), Delaware (2.5%, a difference of 0.43%), and Osage (2.5%, a difference of 0.46%).
| Demographics | Rating | Rank | Single Father Households |
| Cajuns | 6.1 /100 | #236 | Tragic 2.5% |
| Sierra Leoneans | 5.9 /100 | #237 | Tragic 2.5% |
| Immigrants | Sierra Leone | 5.8 /100 | #238 | Tragic 2.5% |
| Immigrants | Oceania | 5.8 /100 | #239 | Tragic 2.5% |
| Immigrants | Dominica | 4.8 /100 | #240 | Tragic 2.5% |
| Portuguese | 4.1 /100 | #241 | Tragic 2.5% |
| Osage | 4.1 /100 | #242 | Tragic 2.5% |
| Spaniards | 3.1 /100 | #243 | Tragic 2.5% |
| Immigrants | Middle Africa | 2.8 /100 | #244 | Tragic 2.5% |
| Basques | 2.5 /100 | #245 | Tragic 2.5% |
| Native Hawaiians | 2.5 /100 | #246 | Tragic 2.5% |
| Delaware | 2.5 /100 | #247 | Tragic 2.5% |
| Bahamians | 2.4 /100 | #248 | Tragic 2.5% |
| Immigrants | Cameroon | 2.3 /100 | #249 | Tragic 2.5% |
| Somalis | 2.1 /100 | #250 | Tragic 2.5% |