Latvian vs Nicaraguan Single Father Households
COMPARE
Latvian
Nicaraguan
Single Father Households
Single Father Households Comparison
Latvians
Nicaraguans
2.0%
SINGLE FATHER HOUSEHOLDS
100.0/ 100
METRIC RATING
44th/ 347
METRIC RANK
2.6%
SINGLE FATHER HOUSEHOLDS
0.1/ 100
METRIC RATING
281st/ 347
METRIC RANK
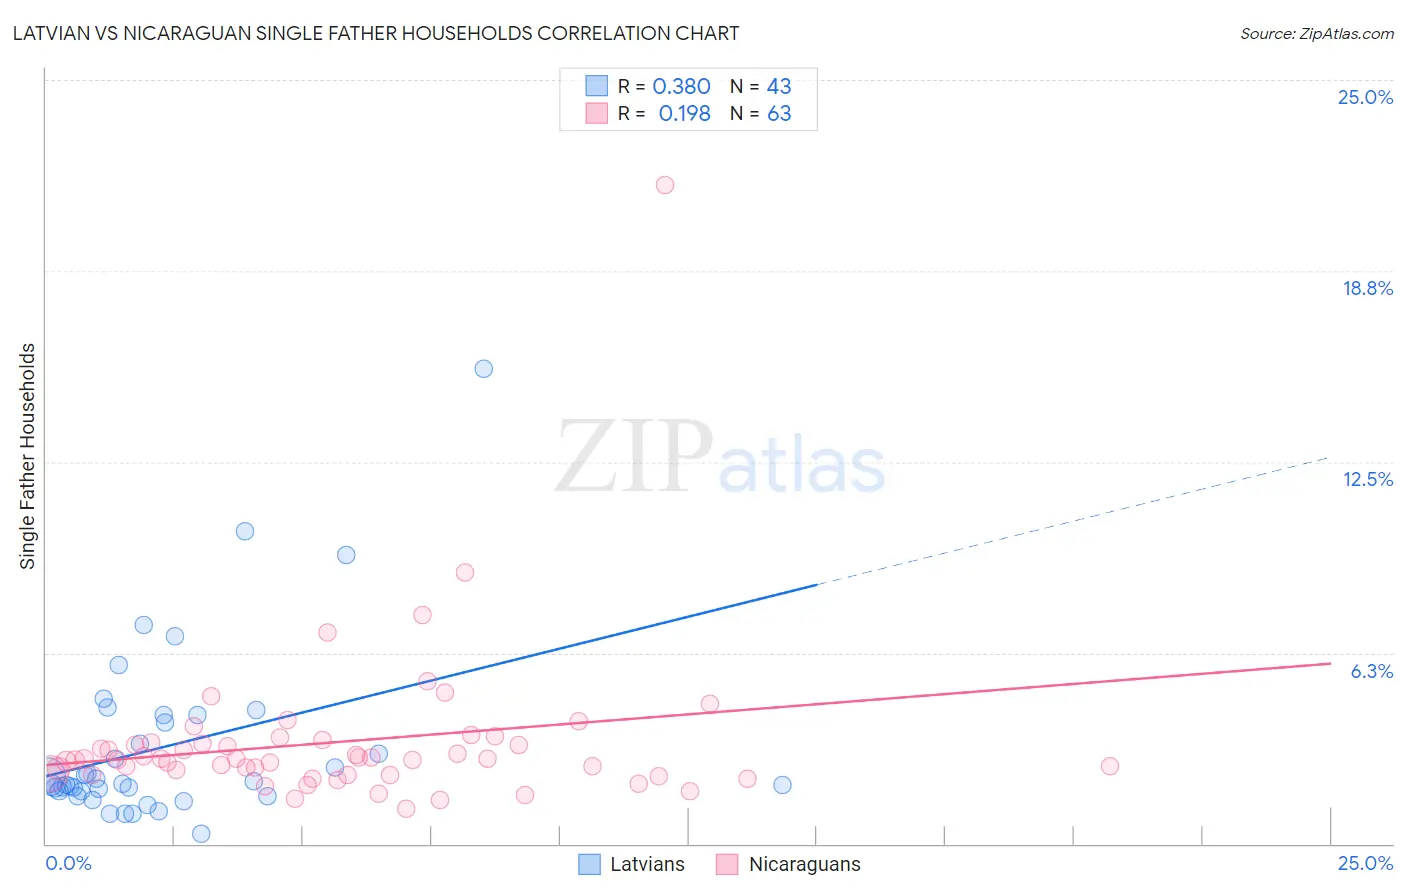
Latvian vs Nicaraguan Single Father Households Correlation Chart
The statistical analysis conducted on geographies consisting of 219,307,286 people shows a mild positive correlation between the proportion of Latvians and percentage of single father households in the United States with a correlation coefficient (R) of 0.380 and weighted average of 2.0%. Similarly, the statistical analysis conducted on geographies consisting of 284,673,398 people shows a poor positive correlation between the proportion of Nicaraguans and percentage of single father households in the United States with a correlation coefficient (R) of 0.198 and weighted average of 2.6%, a difference of 31.6%.
Single Father Households Correlation Summary
| Measurement | Latvian | Nicaraguan |
| Minimum | 0.31% | 1.1% |
| Maximum | 15.6% | 21.5% |
| Range | 15.2% | 20.4% |
| Mean | 3.2% | 3.3% |
| Median | 2.0% | 2.8% |
| Interquartile 25% (IQ1) | 1.7% | 2.3% |
| Interquartile 75% (IQ3) | 4.2% | 3.3% |
| Interquartile Range (IQR) | 2.5% | 1.0% |
| Standard Deviation (Sample) | 2.9% | 2.7% |
| Standard Deviation (Population) | 2.9% | 2.7% |
Similar Demographics by Single Father Households
Demographics Similar to Latvians by Single Father Households
In terms of single father households, the demographic groups most similar to Latvians are Russian (2.0%, a difference of 0.020%), Immigrants from Grenada (2.0%, a difference of 0.090%), Immigrants from Lebanon (2.0%, a difference of 0.12%), Macedonian (2.0%, a difference of 0.31%), and Immigrants from Turkey (2.0%, a difference of 0.46%).
| Demographics | Rating | Rank | Single Father Households |
| Immigrants | St. Vincent and the Grenadines | 100.0 /100 | #37 | Exceptional 2.0% |
| Immigrants | Eastern Europe | 100.0 /100 | #38 | Exceptional 2.0% |
| Immigrants | Sri Lanka | 100.0 /100 | #39 | Exceptional 2.0% |
| Immigrants | Bulgaria | 100.0 /100 | #40 | Exceptional 2.0% |
| Immigrants | Turkey | 100.0 /100 | #41 | Exceptional 2.0% |
| Macedonians | 100.0 /100 | #42 | Exceptional 2.0% |
| Immigrants | Grenada | 100.0 /100 | #43 | Exceptional 2.0% |
| Latvians | 100.0 /100 | #44 | Exceptional 2.0% |
| Russians | 100.0 /100 | #45 | Exceptional 2.0% |
| Immigrants | Lebanon | 100.0 /100 | #46 | Exceptional 2.0% |
| Immigrants | Ukraine | 99.9 /100 | #47 | Exceptional 2.0% |
| Immigrants | Kazakhstan | 99.9 /100 | #48 | Exceptional 2.0% |
| Immigrants | Serbia | 99.9 /100 | #49 | Exceptional 2.0% |
| Immigrants | Switzerland | 99.9 /100 | #50 | Exceptional 2.0% |
| Immigrants | Poland | 99.9 /100 | #51 | Exceptional 2.0% |
Demographics Similar to Nicaraguans by Single Father Households
In terms of single father households, the demographic groups most similar to Nicaraguans are Immigrants from Portugal (2.6%, a difference of 0.010%), Dutch West Indian (2.6%, a difference of 0.050%), Samoan (2.6%, a difference of 0.56%), Cherokee (2.6%, a difference of 0.60%), and Shoshone (2.6%, a difference of 0.65%).
| Demographics | Rating | Rank | Single Father Households |
| Puerto Ricans | 0.2 /100 | #274 | Tragic 2.6% |
| Immigrants | Dominican Republic | 0.2 /100 | #275 | Tragic 2.6% |
| Immigrants | Haiti | 0.1 /100 | #276 | Tragic 2.6% |
| Shoshone | 0.1 /100 | #277 | Tragic 2.6% |
| Cherokee | 0.1 /100 | #278 | Tragic 2.6% |
| Samoans | 0.1 /100 | #279 | Tragic 2.6% |
| Immigrants | Portugal | 0.1 /100 | #280 | Tragic 2.6% |
| Nicaraguans | 0.1 /100 | #281 | Tragic 2.6% |
| Dutch West Indians | 0.1 /100 | #282 | Tragic 2.6% |
| Immigrants | Nicaragua | 0.1 /100 | #283 | Tragic 2.7% |
| Hawaiians | 0.1 /100 | #284 | Tragic 2.7% |
| Ottawa | 0.1 /100 | #285 | Tragic 2.7% |
| Immigrants | Cuba | 0.1 /100 | #286 | Tragic 2.7% |
| Central American Indians | 0.0 /100 | #287 | Tragic 2.7% |
| Immigrants | Cambodia | 0.0 /100 | #288 | Tragic 2.7% |