Latvian vs Immigrants from Netherlands Married-couple Households
COMPARE
Latvian
Immigrants from Netherlands
Married-couple Households
Married-couple Households Comparison
Latvians
Immigrants from Netherlands
47.9%
MARRIED-COUPLE HOUSEHOLDS
96.5/ 100
METRIC RATING
97th/ 347
METRIC RANK
48.2%
MARRIED-COUPLE HOUSEHOLDS
98.2/ 100
METRIC RATING
79th/ 347
METRIC RANK
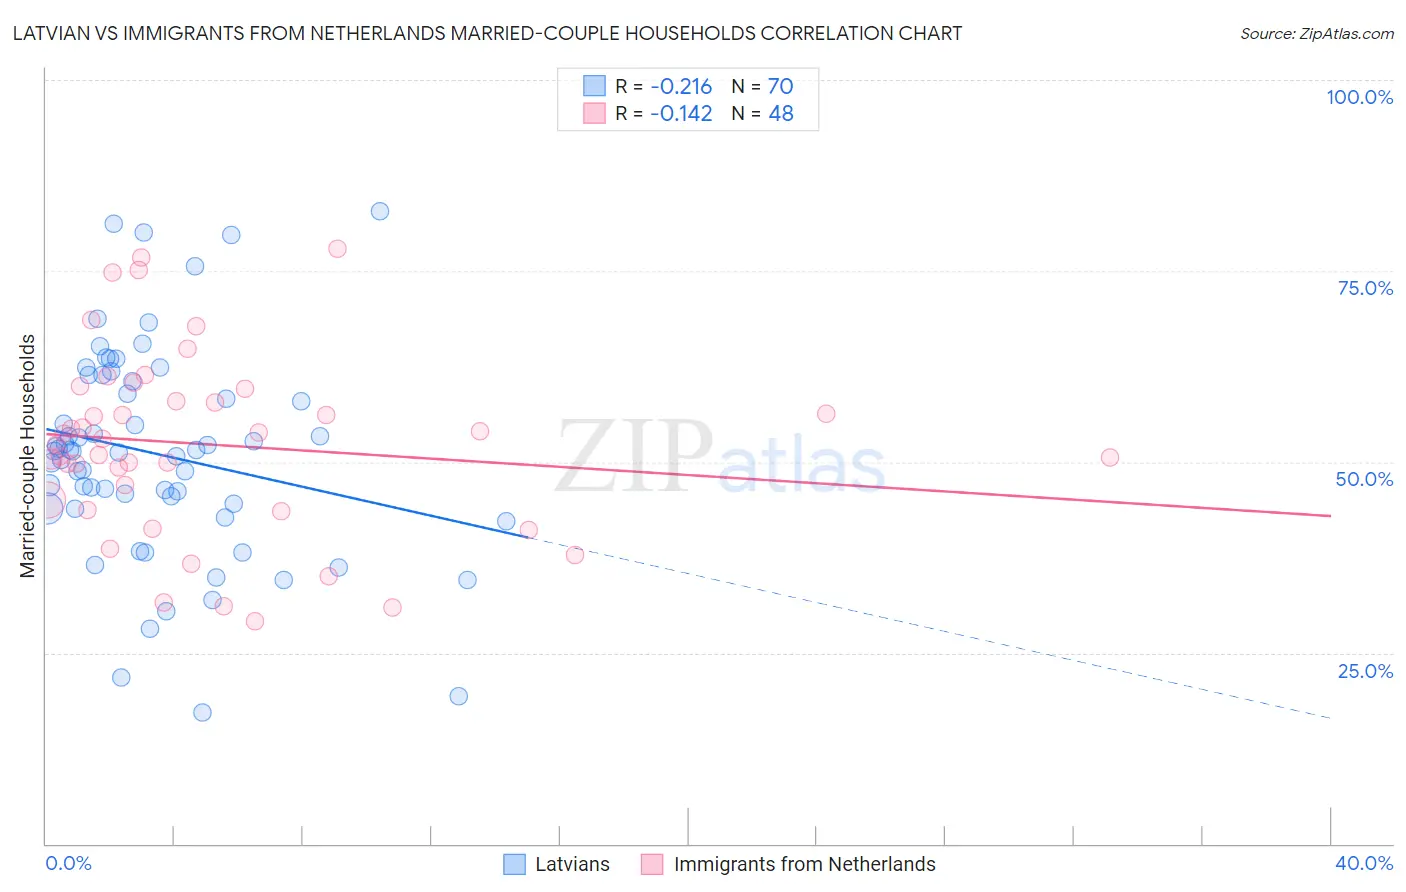
Latvian vs Immigrants from Netherlands Married-couple Households Correlation Chart
The statistical analysis conducted on geographies consisting of 220,654,230 people shows a weak negative correlation between the proportion of Latvians and percentage of married-couple family households in the United States with a correlation coefficient (R) of -0.216 and weighted average of 47.9%. Similarly, the statistical analysis conducted on geographies consisting of 237,797,342 people shows a poor negative correlation between the proportion of Immigrants from Netherlands and percentage of married-couple family households in the United States with a correlation coefficient (R) of -0.142 and weighted average of 48.2%, a difference of 0.62%.
Married-couple Households Correlation Summary
| Measurement | Latvian | Immigrants from Netherlands |
| Minimum | 17.2% | 29.2% |
| Maximum | 82.8% | 77.9% |
| Range | 65.5% | 48.7% |
| Mean | 51.0% | 52.3% |
| Median | 51.4% | 52.7% |
| Interquartile 25% (IQ1) | 43.9% | 44.4% |
| Interquartile 75% (IQ3) | 60.6% | 58.8% |
| Interquartile Range (IQR) | 16.7% | 14.4% |
| Standard Deviation (Sample) | 13.8% | 12.0% |
| Standard Deviation (Population) | 13.7% | 11.9% |
Demographics Similar to Latvians and Immigrants from Netherlands by Married-couple Households
In terms of married-couple households, the demographic groups most similar to Latvians are Immigrants from North Macedonia (47.9%, a difference of 0.010%), Immigrants from Egypt (47.9%, a difference of 0.030%), Immigrants from Belgium (47.9%, a difference of 0.080%), Lebanese (47.9%, a difference of 0.11%), and American (47.9%, a difference of 0.11%). Similarly, the demographic groups most similar to Immigrants from Netherlands are Egyptian (48.2%, a difference of 0.010%), Russian (48.2%, a difference of 0.020%), Finnish (48.1%, a difference of 0.090%), Immigrants from Poland (48.1%, a difference of 0.23%), and Guamanian/Chamorro (48.1%, a difference of 0.25%).
| Demographics | Rating | Rank | Married-couple Households |
| Egyptians | 98.2 /100 | #78 | Exceptional 48.2% |
| Immigrants | Netherlands | 98.2 /100 | #79 | Exceptional 48.2% |
| Russians | 98.1 /100 | #80 | Exceptional 48.2% |
| Finns | 98.0 /100 | #81 | Exceptional 48.1% |
| Immigrants | Poland | 97.7 /100 | #82 | Exceptional 48.1% |
| Guamanians/Chamorros | 97.6 /100 | #83 | Exceptional 48.1% |
| Ukrainians | 97.6 /100 | #84 | Exceptional 48.1% |
| Immigrants | Israel | 97.4 /100 | #85 | Exceptional 48.0% |
| Belgians | 97.4 /100 | #86 | Exceptional 48.0% |
| Immigrants | Ireland | 97.3 /100 | #87 | Exceptional 48.0% |
| Afghans | 97.3 /100 | #88 | Exceptional 48.0% |
| Cypriots | 97.2 /100 | #89 | Exceptional 48.0% |
| French | 97.2 /100 | #90 | Exceptional 48.0% |
| Immigrants | Moldova | 97.0 /100 | #91 | Exceptional 48.0% |
| Palestinians | 96.9 /100 | #92 | Exceptional 48.0% |
| Lebanese | 96.9 /100 | #93 | Exceptional 47.9% |
| Americans | 96.9 /100 | #94 | Exceptional 47.9% |
| Immigrants | Belgium | 96.8 /100 | #95 | Exceptional 47.9% |
| Immigrants | Egypt | 96.6 /100 | #96 | Exceptional 47.9% |
| Latvians | 96.5 /100 | #97 | Exceptional 47.9% |
| Immigrants | North Macedonia | 96.4 /100 | #98 | Exceptional 47.9% |