Kenyan vs Immigrants from Saudi Arabia Births to Unmarried Women

COMPARE

Kenyan
Race
Ancestry
AfghanAfricanAlaska NativeAlaskan AthabascanAlbanianAleutAlsatianAmericanApacheArabArapahoArgentineanArmenianAssyrian/Chaldean/SyriacAustralianAustrianBahamianBangladeshiBarbadianBasqueBelgianBelizeanBermudanBhutaneseBlackfeetBolivianBrazilianBritishBritish West IndianBulgarianBurmeseCajunCambodianCanadianCape VerdeanCarpatho RusynCelticCentral AmericanCentral American IndianCherokeeCheyenneChickasawChileanChineseChippewaChoctawColombianColvilleComancheCosta RicanCreeCreekCroatianCrowCubanCypriotCzechCzechoslovakianDanishDelawareDominicanDutchDutch West IndianEastern EuropeanEcuadorianEgyptianEnglishEstonianEthiopianEuropeanFijianFilipinoFinnishFrenchFrench American IndianFrench CanadianGermanGerman RussianGhanaianGreekGuamanian/ChamorroGuatemalanGuyaneseHaitianHmongHonduranHopiHoumaHungarianIcelanderIndian (Asian)IndonesianInupiatIranianIraqiIrishIroquoisIsraeliItalianJamaicanJapaneseJordanianKenyanKiowaKoreanLaotianLatvianLebaneseLiberianLithuanianLumbeeLuxembourgerMacedonianMalaysianMalteseMarshalleseMenomineeMexicanMexican American IndianMongolianMoroccanNative HawaiianNavajoNepaleseNew ZealanderNicaraguanNigerianNorthern EuropeanNorwegianOkinawanOsageOttawaPaiutePakistaniPalestinianPanamanianParaguayanPennsylvania GermanPeruvianPimaPolishPortuguesePotawatomiPuebloPuerto RicanPuget Sound SalishRomanianRussianSalvadoranSamoanScandinavianScotch-IrishScottishSeminoleSenegaleseSerbianShoshoneSierra LeoneanSiouxSlavicSlovakSloveneSomaliSouth AfricanSouth AmericanSouth American IndianSoviet UnionSpaniardSpanishSpanish AmericanSpanish American IndianSri LankanSubsaharan AfricanSudaneseSwedishSwissSyrianTaiwaneseThaiTlingit-HaidaTohono O'OdhamTonganTrinidadian and TobagonianTsimshianTurkishU.S. Virgin IslanderUgandanUkrainianUruguayanUteVenezuelanVietnameseWelshWest IndianYakamaYaquiYugoslavianYumanYup'ikZimbabwean
Immigration
NonimmigrantsImmigrantsAfghanistanAfricaAlbaniaArgentinaArmeniaAsiaAustraliaAustriaBahamasBangladeshBarbadosBelarusBelgiumBelizeBoliviaBosnia and HerzegovinaBrazilBulgariaBurma/MyanmarCabo VerdeCambodiaCameroonCanadaCaribbeanCentral AmericaChileChinaColombiaCongoCosta RicaCroatiaCubaCzechoslovakiaDenmarkDominicaDominican RepublicEastern AfricaEastern AsiaEastern EuropeEcuadorEgyptEl SalvadorEnglandEritreaEthiopiaEuropeFijiFranceGermanyGhanaGreeceGrenadaGuatemalaGuyanaHaitiHondurasHong KongHungaryIndiaIndonesiaIranIraqIrelandIsraelItalyJamaicaJapanJordanKazakhstanKenyaKoreaKuwaitLaosLatin AmericaLatviaLebanonLiberiaLithuaniaMalaysiaMexicoMicronesiaMiddle AfricaMoldovaMoroccoNepalNetherlandsNicaraguaNigeriaNorth AmericaNorth MacedoniaNorthern AfricaNorthern EuropeNorwayOceaniaPakistanPanamaPeruPhilippinesPolandPortugalRomaniaRussiaScotlandSenegalSerbiaSierra LeoneSingaporeSomaliaSouth AfricaSouth AmericaSouth Central AsiaSouth Eastern AsiaSouthern EuropeSpainSri LankaSt. Vincent and the GrenadinesSudanSwedenSwitzerlandSyriaTaiwanThailandTrinidad and TobagoTurkeyUgandaUkraineUruguayUzbekistanVenezuelaVietnamWest IndiesWestern AfricaWestern AsiaWestern EuropeYemenZaireZimbabweAzores
Immigrants from Saudi Arabia
Race
Ancestry
AfghanAfricanAlaska NativeAlaskan AthabascanAlbanianAleutAlsatianAmericanApacheArabArapahoArgentineanArmenianAssyrian/Chaldean/SyriacAustralianAustrianBahamianBangladeshiBarbadianBasqueBelgianBelizeanBermudanBhutaneseBlackfeetBolivianBrazilianBritishBritish West IndianBulgarianBurmeseCajunCambodianCanadianCape VerdeanCarpatho RusynCelticCentral AmericanCentral American IndianCherokeeCheyenneChickasawChileanChineseChippewaChoctawColombianColvilleComancheCosta RicanCreeCreekCroatianCrowCubanCypriotCzechCzechoslovakianDanishDelawareDominicanDutchDutch West IndianEastern EuropeanEcuadorianEgyptianEnglishEstonianEthiopianEuropeanFijianFilipinoFinnishFrenchFrench American IndianFrench CanadianGermanGerman RussianGhanaianGreekGuamanian/ChamorroGuatemalanGuyaneseHaitianHmongHonduranHopiHoumaHungarianIcelanderIndian (Asian)IndonesianInupiatIranianIraqiIrishIroquoisIsraeliItalianJamaicanJapaneseJordanianKiowaKoreanLaotianLatvianLebaneseLiberianLithuanianLumbeeLuxembourgerMacedonianMalaysianMalteseMarshalleseMenomineeMexicanMexican American IndianMongolianMoroccanNative HawaiianNavajoNepaleseNew ZealanderNicaraguanNigerianNorthern EuropeanNorwegianOkinawanOsageOttawaPaiutePakistaniPalestinianPanamanianParaguayanPennsylvania GermanPeruvianPimaPolishPortuguesePotawatomiPuebloPuerto RicanPuget Sound SalishRomanianRussianSalvadoranSamoanScandinavianScotch-IrishScottishSeminoleSenegaleseSerbianShoshoneSierra LeoneanSiouxSlavicSlovakSloveneSomaliSouth AfricanSouth AmericanSouth American IndianSoviet UnionSpaniardSpanishSpanish AmericanSpanish American IndianSri LankanSubsaharan AfricanSudaneseSwedishSwissSyrianTaiwaneseThaiTlingit-HaidaTohono O'OdhamTonganTrinidadian and TobagonianTsimshianTurkishU.S. Virgin IslanderUgandanUkrainianUruguayanUteVenezuelanVietnameseWelshWest IndianYakamaYaquiYugoslavianYumanYup'ikZimbabwean
Immigration
NonimmigrantsImmigrantsAfghanistanAfricaAlbaniaArgentinaArmeniaAsiaAustraliaAustriaBahamasBangladeshBarbadosBelarusBelgiumBelizeBoliviaBosnia and HerzegovinaBrazilBulgariaBurma/MyanmarCabo VerdeCambodiaCameroonCanadaCaribbeanCentral AmericaChileChinaColombiaCongoCosta RicaCroatiaCubaCzechoslovakiaDenmarkDominicaDominican RepublicEastern AfricaEastern AsiaEastern EuropeEcuadorEgyptEl SalvadorEnglandEritreaEthiopiaEuropeFijiFranceGermanyGhanaGreeceGrenadaGuatemalaGuyanaHaitiHondurasHong KongHungaryIndiaIndonesiaIranIraqIrelandIsraelItalyJamaicaJapanJordanKazakhstanKenyaKoreaKuwaitLaosLatin AmericaLatviaLebanonLiberiaLithuaniaMalaysiaMexicoMicronesiaMiddle AfricaMoldovaMoroccoNepalNetherlandsNicaraguaNigeriaNorth AmericaNorth MacedoniaNorthern AfricaNorthern EuropeNorwayOceaniaPakistanPanamaPeruPhilippinesPolandPortugalRomaniaRussiaSaudi ArabiaScotlandSenegalSerbiaSierra LeoneSingaporeSomaliaSouth AfricaSouth AmericaSouth Central AsiaSouth Eastern AsiaSouthern EuropeSpainSri LankaSt. Vincent and the GrenadinesSudanSwedenSwitzerlandSyriaTaiwanThailandTrinidad and TobagoTurkeyUgandaUkraineUruguayUzbekistanVenezuelaVietnamWest IndiesWestern AfricaWestern AsiaWestern EuropeYemenZaireZimbabweAzores
Births to Unmarried Women
Income
Poverty
Unemployment
Labor Participation
Family Structure
Vehicle Availability
Education Level
Disability

Births to Unmarried Women Comparison

Kenyans

Immigrants from Saudi Arabia

Average
Exceptional
31.9%
BIRTHS TO UNMARRIED WOMEN
43.0/ 100
METRIC RATING
182nd/ 347
METRIC RANK
29.1%
BIRTHS TO UNMARRIED WOMEN
97.0/ 100
METRIC RATING
89th/ 347
METRIC RANK

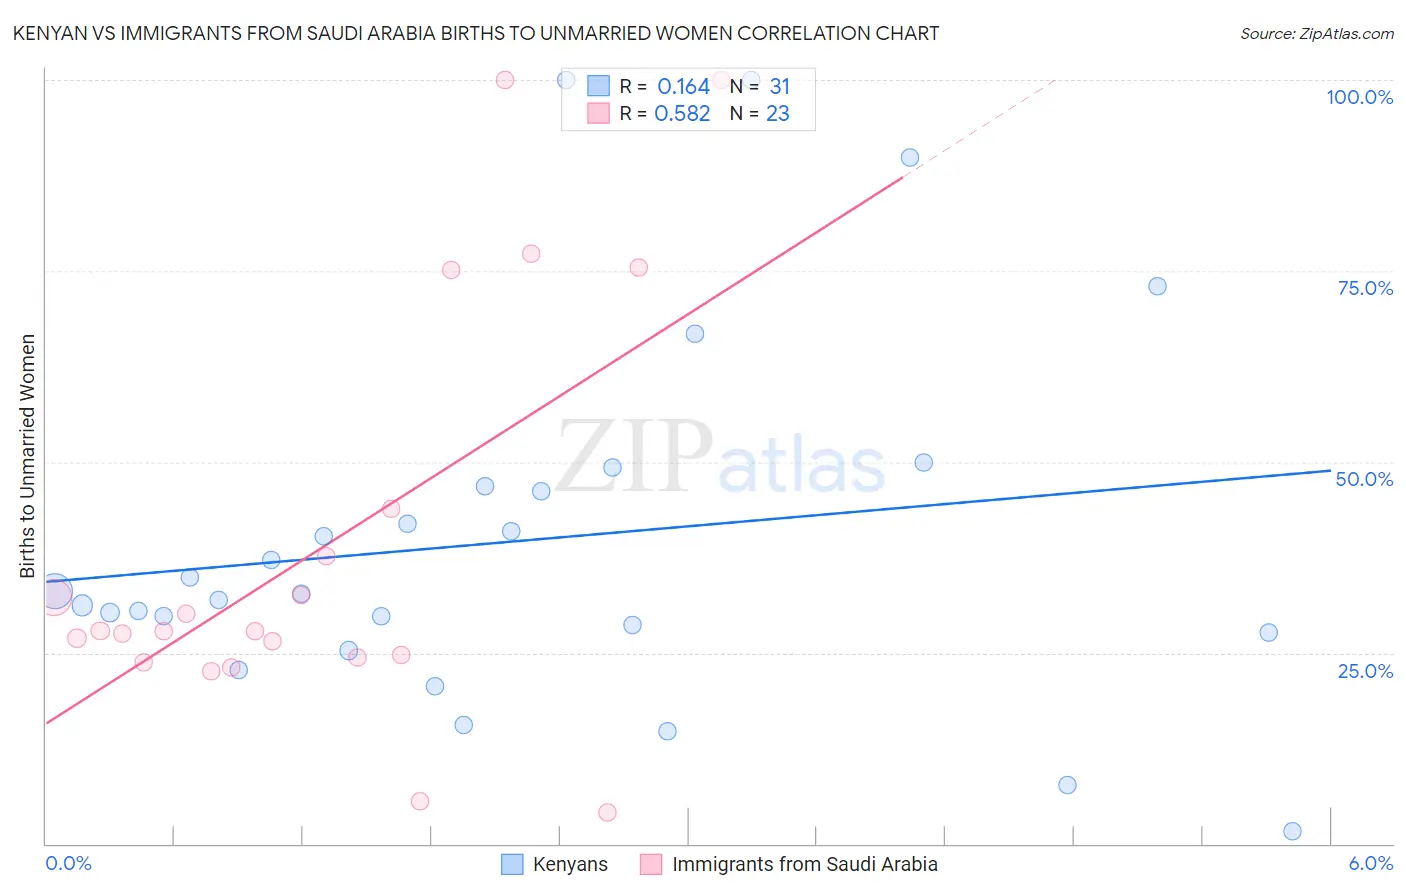
Kenyan vs Immigrants from Saudi Arabia Births to Unmarried Women Correlation Chart

The statistical analysis conducted on geographies consisting of 163,852,803 people shows a poor positive correlation between the proportion of Kenyans and percentage of births to unmarried women in the United States with a correlation coefficient (R) of 0.164 and weighted average of 31.9%. Similarly, the statistical analysis conducted on geographies consisting of 158,618,627 people shows a substantial positive correlation between the proportion of Immigrants from Saudi Arabia and percentage of births to unmarried women in the United States with a correlation coefficient (R) of 0.582 and weighted average of 29.1%, a difference of 9.7%.
Kenyan vs Immigrants from Saudi Arabia Births to Unmarried Women

Births to Unmarried Women Correlation Summary

MeasurementKenyanImmigrants from Saudi Arabia
Minimum1.6%4.0%
Maximum100.0%100.0%
Range98.4%96.0%
Mean39.7%39.0%
Median32.7%27.8%
Interquartile 25% (IQ1)27.6%24.4%
Interquartile 75% (IQ3)46.9%43.8%
Interquartile Range (IQR)19.3%19.4%
Standard Deviation (Sample)24.0%27.0%
Standard Deviation (Population)23.7%26.4%

Similar Demographics by Births to Unmarried Women

Demographics Similar to Kenyans by Births to Unmarried Women

In terms of births to unmarried women, the demographic groups most similar to Kenyans are Canadian (31.9%, a difference of 0.16%), Immigrants from Peru (31.8%, a difference of 0.20%), Immigrants from South America (32.0%, a difference of 0.23%), Moroccan (31.8%, a difference of 0.26%), and German (32.0%, a difference of 0.34%).
DemographicsRating | RankBirths to Unmarried Women
Immigrants | Venezuela
49.2
/100
|
#175
Average
31.7%
Scottish
48.1
/100
|
#176
Average
31.7%
South American Indians
47.7
/100
|
#177
Average
31.7%
English
47.4
/100
|
#178
Average
31.7%
South Americans
46.9
/100
|
#179
Average
31.8%
Moroccans
45.7
/100
|
#180
Average
31.8%
Immigrants | Peru
45.1
/100
|
#181
Average
31.8%
Kenyans
43.0
/100
|
#182
Average
31.9%
Canadians
41.4
/100
|
#183
Average
31.9%
Immigrants | South America
40.7
/100
|
#184
Average
32.0%
Germans
39.5
/100
|
#185
Fair
32.0%
Welsh
38.2
/100
|
#186
Fair
32.0%
Czechoslovakians
38.0
/100
|
#187
Fair
32.0%
Osage
37.1
/100
|
#188
Fair
32.1%
Immigrants | Kenya
36.9
/100
|
#189
Fair
32.1%

Demographics Similar to Immigrants from Saudi Arabia by Births to Unmarried Women

In terms of births to unmarried women, the demographic groups most similar to Immigrants from Saudi Arabia are Immigrants from Latvia (29.1%, a difference of 0.16%), Taiwanese (29.0%, a difference of 0.28%), Immigrants from France (29.0%, a difference of 0.28%), Immigrants from Jordan (29.0%, a difference of 0.36%), and Immigrants from Fiji (29.2%, a difference of 0.37%).
DemographicsRating | RankBirths to Unmarried Women
Romanians
98.0
/100
|
#82
Exceptional
28.7%
Immigrants | Kuwait
98.0
/100
|
#83
Exceptional
28.8%
Immigrants | Poland
97.6
/100
|
#84
Exceptional
28.9%
Sri Lankans
97.5
/100
|
#85
Exceptional
28.9%
Immigrants | Jordan
97.4
/100
|
#86
Exceptional
29.0%
Taiwanese
97.3
/100
|
#87
Exceptional
29.0%
Immigrants | France
97.3
/100
|
#88
Exceptional
29.0%
Immigrants | Saudi Arabia
97.0
/100
|
#89
Exceptional
29.1%
Immigrants | Latvia
96.8
/100
|
#90
Exceptional
29.1%
Immigrants | Fiji
96.6
/100
|
#91
Exceptional
29.2%
Arabs
96.5
/100
|
#92
Exceptional
29.2%
Estonians
96.5
/100
|
#93
Exceptional
29.2%
Ukrainians
96.3
/100
|
#94
Exceptional
29.2%
Immigrants | Vietnam
96.1
/100
|
#95
Exceptional
29.3%
Norwegians
95.8
/100
|
#96
Exceptional
29.3%