Hungarian vs Immigrants from Saudi Arabia Births to Unmarried Women
COMPARE
Hungarian
Immigrants from Saudi Arabia
Births to Unmarried Women
Births to Unmarried Women Comparison
Hungarians
Immigrants from Saudi Arabia
31.2%
BIRTHS TO UNMARRIED WOMEN
64.1/ 100
METRIC RATING
164th/ 347
METRIC RANK
29.1%
BIRTHS TO UNMARRIED WOMEN
97.0/ 100
METRIC RATING
89th/ 347
METRIC RANK
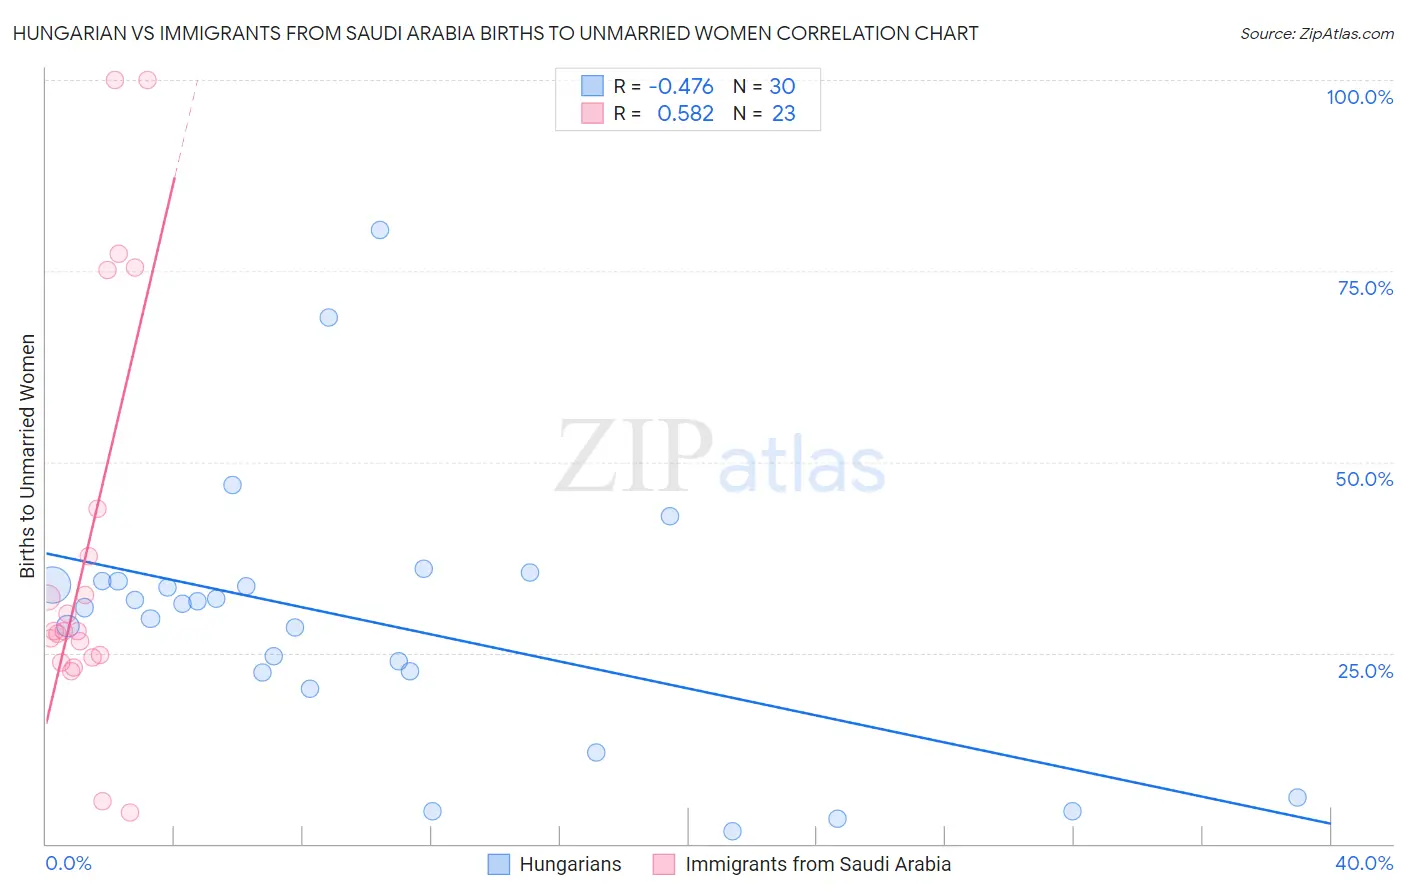
Hungarian vs Immigrants from Saudi Arabia Births to Unmarried Women Correlation Chart
The statistical analysis conducted on geographies consisting of 440,971,373 people shows a moderate negative correlation between the proportion of Hungarians and percentage of births to unmarried women in the United States with a correlation coefficient (R) of -0.476 and weighted average of 31.2%. Similarly, the statistical analysis conducted on geographies consisting of 158,618,627 people shows a substantial positive correlation between the proportion of Immigrants from Saudi Arabia and percentage of births to unmarried women in the United States with a correlation coefficient (R) of 0.582 and weighted average of 29.1%, a difference of 7.5%.
Births to Unmarried Women Correlation Summary
| Measurement | Hungarian | Immigrants from Saudi Arabia |
| Minimum | 1.6% | 4.0% |
| Maximum | 80.4% | 100.0% |
| Range | 78.8% | 96.0% |
| Mean | 29.0% | 39.0% |
| Median | 31.2% | 27.8% |
| Interquartile 25% (IQ1) | 22.4% | 24.4% |
| Interquartile 75% (IQ3) | 34.3% | 43.8% |
| Interquartile Range (IQR) | 12.0% | 19.4% |
| Standard Deviation (Sample) | 17.3% | 27.0% |
| Standard Deviation (Population) | 17.0% | 26.4% |
Similar Demographics by Births to Unmarried Women
Demographics Similar to Hungarians by Births to Unmarried Women
In terms of births to unmarried women, the demographic groups most similar to Hungarians are Immigrants from Chile (31.2%, a difference of 0.17%), Slovene (31.2%, a difference of 0.19%), Immigrants from Southern Europe (31.1%, a difference of 0.50%), Immigrants from England (31.1%, a difference of 0.57%), and Immigrants from Western Europe (31.1%, a difference of 0.57%).
| Demographics | Rating | Rank | Births to Unmarried Women |
| Immigrants | Eastern Africa | 72.1 /100 | #157 | Good 31.0% |
| Austrians | 69.9 /100 | #158 | Good 31.0% |
| Immigrants | England | 69.4 /100 | #159 | Good 31.1% |
| Immigrants | Western Europe | 69.3 /100 | #160 | Good 31.1% |
| Immigrants | Southern Europe | 68.7 /100 | #161 | Good 31.1% |
| Slovenes | 65.9 /100 | #162 | Good 31.2% |
| Immigrants | Chile | 65.7 /100 | #163 | Good 31.2% |
| Hungarians | 64.1 /100 | #164 | Good 31.2% |
| Immigrants | Somalia | 58.1 /100 | #165 | Average 31.4% |
| Peruvians | 55.5 /100 | #166 | Average 31.5% |
| Dutch | 55.3 /100 | #167 | Average 31.5% |
| Belgians | 52.4 /100 | #168 | Average 31.6% |
| Slavs | 52.0 /100 | #169 | Average 31.6% |
| Guamanians/Chamorros | 51.3 /100 | #170 | Average 31.6% |
| Finns | 50.5 /100 | #171 | Average 31.7% |
Demographics Similar to Immigrants from Saudi Arabia by Births to Unmarried Women
In terms of births to unmarried women, the demographic groups most similar to Immigrants from Saudi Arabia are Immigrants from Latvia (29.1%, a difference of 0.16%), Taiwanese (29.0%, a difference of 0.28%), Immigrants from France (29.0%, a difference of 0.28%), Immigrants from Jordan (29.0%, a difference of 0.36%), and Immigrants from Fiji (29.2%, a difference of 0.37%).
| Demographics | Rating | Rank | Births to Unmarried Women |
| Romanians | 98.0 /100 | #82 | Exceptional 28.7% |
| Immigrants | Kuwait | 98.0 /100 | #83 | Exceptional 28.8% |
| Immigrants | Poland | 97.6 /100 | #84 | Exceptional 28.9% |
| Sri Lankans | 97.5 /100 | #85 | Exceptional 28.9% |
| Immigrants | Jordan | 97.4 /100 | #86 | Exceptional 29.0% |
| Taiwanese | 97.3 /100 | #87 | Exceptional 29.0% |
| Immigrants | France | 97.3 /100 | #88 | Exceptional 29.0% |
| Immigrants | Saudi Arabia | 97.0 /100 | #89 | Exceptional 29.1% |
| Immigrants | Latvia | 96.8 /100 | #90 | Exceptional 29.1% |
| Immigrants | Fiji | 96.6 /100 | #91 | Exceptional 29.2% |
| Arabs | 96.5 /100 | #92 | Exceptional 29.2% |
| Estonians | 96.5 /100 | #93 | Exceptional 29.2% |
| Ukrainians | 96.3 /100 | #94 | Exceptional 29.2% |
| Immigrants | Vietnam | 96.1 /100 | #95 | Exceptional 29.3% |
| Norwegians | 95.8 /100 | #96 | Exceptional 29.3% |