Jamaican vs Immigrants from Cuba Married-couple Households
COMPARE
Jamaican
Immigrants from Cuba
Married-couple Households
Married-couple Households Comparison
Jamaicans
Immigrants from Cuba
40.9%
MARRIED-COUPLE HOUSEHOLDS
0.0/ 100
METRIC RATING
314th/ 347
METRIC RANK
44.2%
MARRIED-COUPLE HOUSEHOLDS
0.6/ 100
METRIC RATING
246th/ 347
METRIC RANK
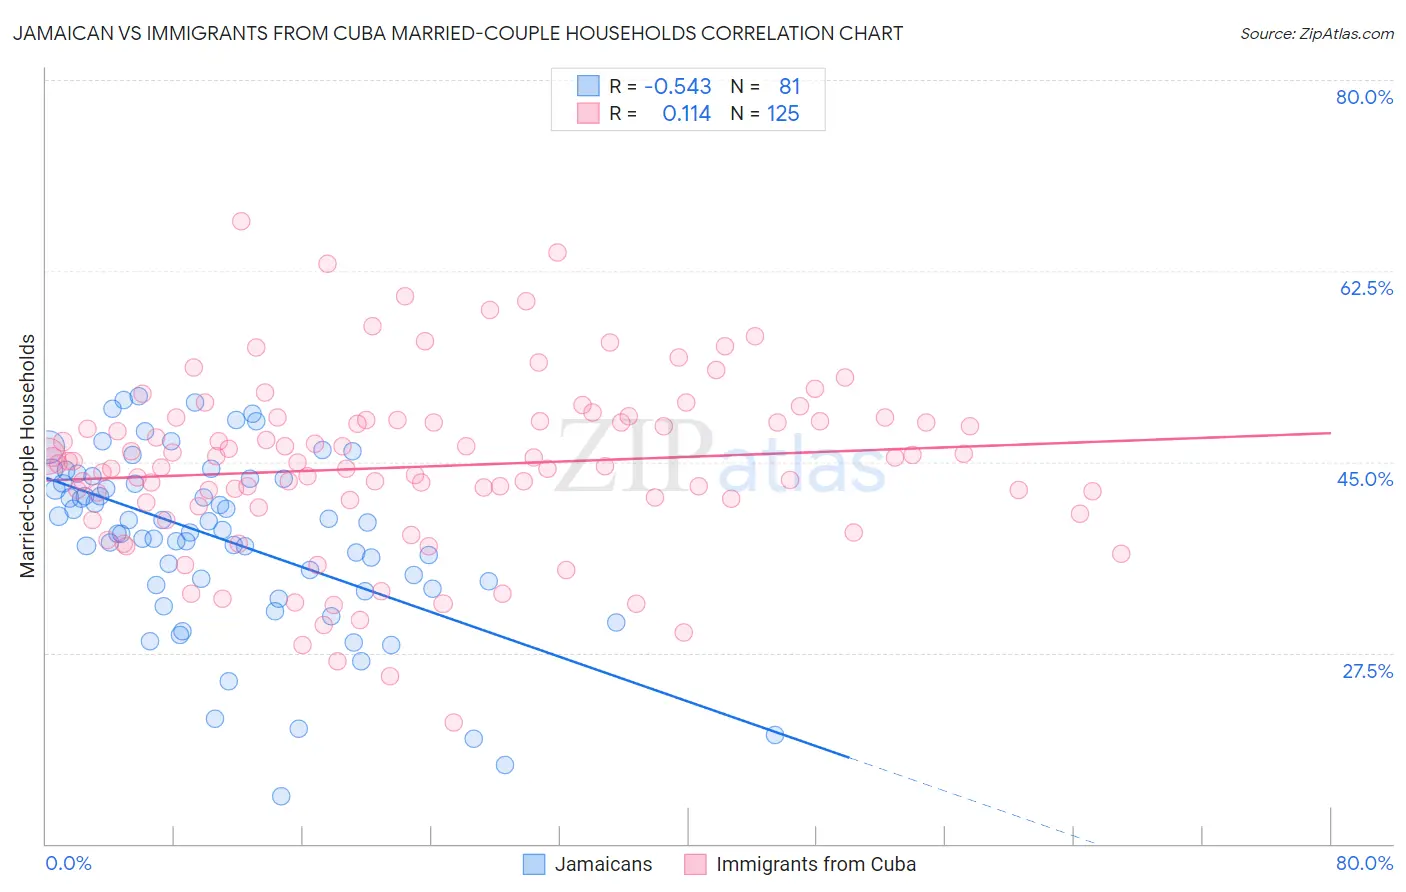
Jamaican vs Immigrants from Cuba Married-couple Households Correlation Chart
The statistical analysis conducted on geographies consisting of 367,621,560 people shows a substantial negative correlation between the proportion of Jamaicans and percentage of married-couple family households in the United States with a correlation coefficient (R) of -0.543 and weighted average of 40.9%. Similarly, the statistical analysis conducted on geographies consisting of 325,949,905 people shows a poor positive correlation between the proportion of Immigrants from Cuba and percentage of married-couple family households in the United States with a correlation coefficient (R) of 0.114 and weighted average of 44.2%, a difference of 8.1%.
Married-couple Households Correlation Summary
| Measurement | Jamaican | Immigrants from Cuba |
| Minimum | 14.3% | 21.2% |
| Maximum | 51.0% | 67.0% |
| Range | 36.7% | 45.8% |
| Mean | 37.9% | 44.6% |
| Median | 38.7% | 44.9% |
| Interquartile 25% (IQ1) | 33.6% | 41.1% |
| Interquartile 75% (IQ3) | 43.5% | 48.7% |
| Interquartile Range (IQR) | 9.9% | 7.6% |
| Standard Deviation (Sample) | 8.1% | 8.0% |
| Standard Deviation (Population) | 8.1% | 8.0% |
Similar Demographics by Married-couple Households
Demographics Similar to Jamaicans by Married-couple Households
In terms of married-couple households, the demographic groups most similar to Jamaicans are Immigrants from Haiti (40.9%, a difference of 0.080%), Trinidadian and Tobagonian (40.9%, a difference of 0.080%), African (40.9%, a difference of 0.14%), Colville (41.0%, a difference of 0.22%), and Immigrants from Caribbean (40.8%, a difference of 0.26%).
| Demographics | Rating | Rank | Married-couple Households |
| Immigrants | Western Africa | 0.0 /100 | #307 | Tragic 41.4% |
| Crow | 0.0 /100 | #308 | Tragic 41.4% |
| Immigrants | Trinidad and Tobago | 0.0 /100 | #309 | Tragic 41.2% |
| Haitians | 0.0 /100 | #310 | Tragic 41.2% |
| Colville | 0.0 /100 | #311 | Tragic 41.0% |
| Africans | 0.0 /100 | #312 | Tragic 40.9% |
| Immigrants | Haiti | 0.0 /100 | #313 | Tragic 40.9% |
| Jamaicans | 0.0 /100 | #314 | Tragic 40.9% |
| Trinidadians and Tobagonians | 0.0 /100 | #315 | Tragic 40.9% |
| Immigrants | Caribbean | 0.0 /100 | #316 | Tragic 40.8% |
| Immigrants | Jamaica | 0.0 /100 | #317 | Tragic 40.7% |
| Liberians | 0.0 /100 | #318 | Tragic 40.7% |
| Bahamians | 0.0 /100 | #319 | Tragic 40.5% |
| West Indians | 0.0 /100 | #320 | Tragic 40.3% |
| Immigrants | Liberia | 0.0 /100 | #321 | Tragic 40.3% |
Demographics Similar to Immigrants from Cuba by Married-couple Households
In terms of married-couple households, the demographic groups most similar to Immigrants from Cuba are Immigrants from Morocco (44.2%, a difference of 0.0%), Immigrants from El Salvador (44.3%, a difference of 0.15%), Immigrants from Armenia (44.3%, a difference of 0.16%), Yup'ik (44.1%, a difference of 0.28%), and Immigrants from Kenya (44.1%, a difference of 0.33%).
| Demographics | Rating | Rank | Married-couple Households |
| Spanish Americans | 1.1 /100 | #239 | Tragic 44.5% |
| Ute | 1.0 /100 | #240 | Tragic 44.4% |
| Immigrants | Bosnia and Herzegovina | 1.0 /100 | #241 | Tragic 44.4% |
| Immigrants | Albania | 1.0 /100 | #242 | Tragic 44.4% |
| Immigrants | Saudi Arabia | 0.9 /100 | #243 | Tragic 44.4% |
| Immigrants | Armenia | 0.7 /100 | #244 | Tragic 44.3% |
| Immigrants | El Salvador | 0.7 /100 | #245 | Tragic 44.3% |
| Immigrants | Cuba | 0.6 /100 | #246 | Tragic 44.2% |
| Immigrants | Morocco | 0.6 /100 | #247 | Tragic 44.2% |
| Yup'ik | 0.4 /100 | #248 | Tragic 44.1% |
| Immigrants | Kenya | 0.4 /100 | #249 | Tragic 44.1% |
| French American Indians | 0.4 /100 | #250 | Tragic 44.1% |
| German Russians | 0.4 /100 | #251 | Tragic 44.0% |
| Seminole | 0.4 /100 | #252 | Tragic 44.0% |
| Central Americans | 0.3 /100 | #253 | Tragic 43.9% |