Italian vs Seminole Divorced or Separated
COMPARE
Italian
Seminole
Divorced or Separated
Divorced or Separated Comparison
Italians
Seminole
11.9%
DIVORCED OR SEPARATED
77.8/ 100
METRIC RATING
148th/ 347
METRIC RANK
14.3%
DIVORCED OR SEPARATED
0.0/ 100
METRIC RATING
342nd/ 347
METRIC RANK
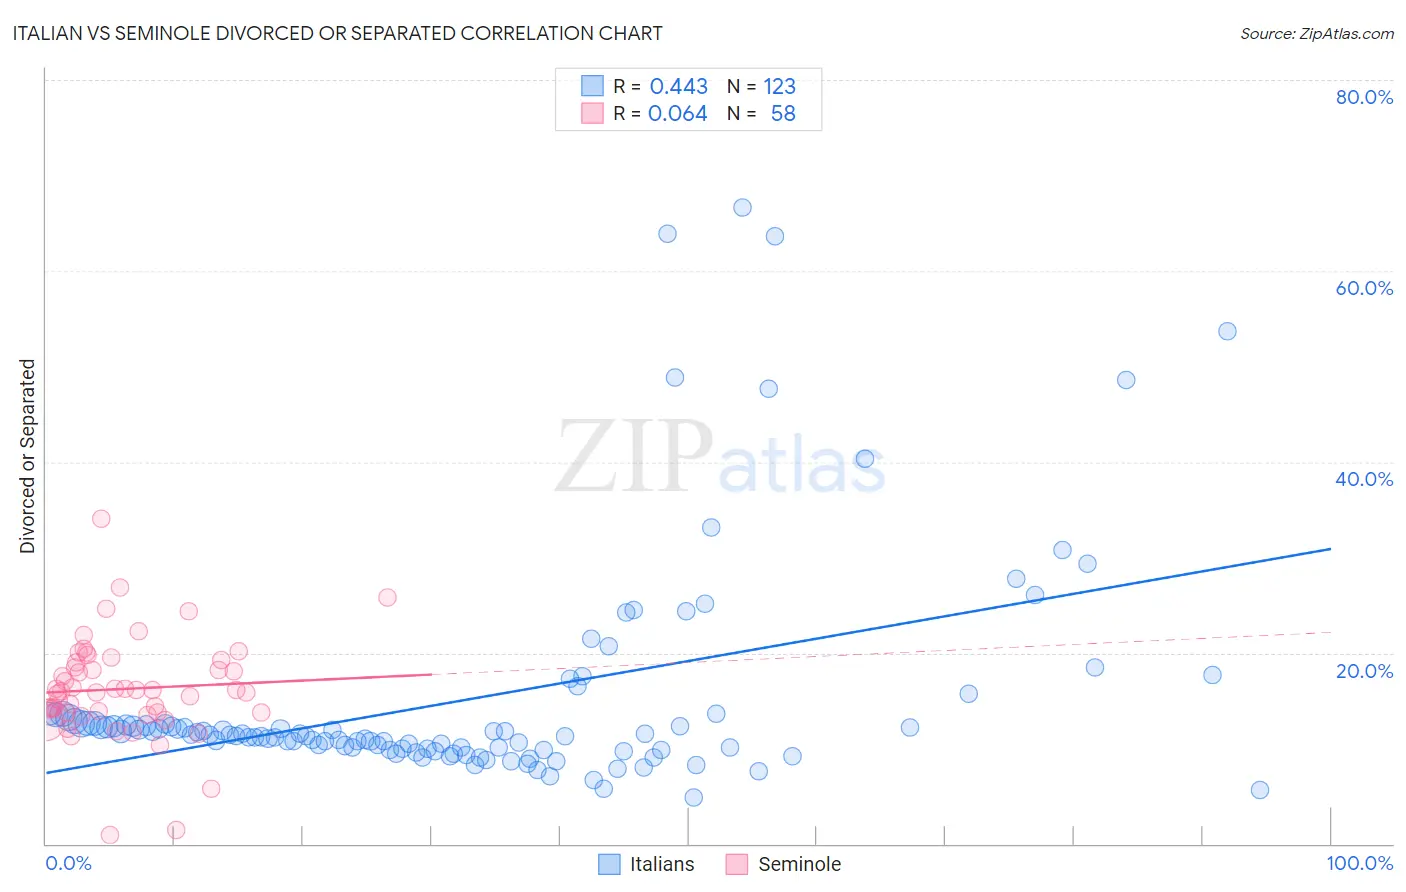
Italian vs Seminole Divorced or Separated Correlation Chart
The statistical analysis conducted on geographies consisting of 574,595,053 people shows a moderate positive correlation between the proportion of Italians and percentage of population currently divorced or separated in the United States with a correlation coefficient (R) of 0.443 and weighted average of 11.9%. Similarly, the statistical analysis conducted on geographies consisting of 118,302,792 people shows a slight positive correlation between the proportion of Seminole and percentage of population currently divorced or separated in the United States with a correlation coefficient (R) of 0.064 and weighted average of 14.3%, a difference of 19.6%.
Divorced or Separated Correlation Summary
| Measurement | Italian | Seminole |
| Minimum | 4.8% | 0.90% |
| Maximum | 66.7% | 34.0% |
| Range | 61.9% | 33.1% |
| Mean | 15.1% | 16.2% |
| Median | 11.4% | 16.1% |
| Interquartile 25% (IQ1) | 10.0% | 13.8% |
| Interquartile 75% (IQ3) | 12.8% | 19.0% |
| Interquartile Range (IQR) | 2.9% | 5.2% |
| Standard Deviation (Sample) | 11.7% | 5.4% |
| Standard Deviation (Population) | 11.6% | 5.3% |
Similar Demographics by Divorced or Separated
Demographics Similar to Italians by Divorced or Separated
In terms of divorced or separated, the demographic groups most similar to Italians are Immigrants from Oceania (11.9%, a difference of 0.0%), Immigrants from Portugal (11.9%, a difference of 0.030%), Polish (11.9%, a difference of 0.040%), Immigrants from Grenada (11.9%, a difference of 0.070%), and Czech (11.9%, a difference of 0.070%).
| Demographics | Rating | Rank | Divorced or Separated |
| Immigrants | Morocco | 82.9 /100 | #141 | Excellent 11.9% |
| Immigrants | Zimbabwe | 81.5 /100 | #142 | Excellent 11.9% |
| Pakistanis | 81.3 /100 | #143 | Excellent 11.9% |
| Peruvians | 80.9 /100 | #144 | Excellent 11.9% |
| Croatians | 80.6 /100 | #145 | Excellent 11.9% |
| Immigrants | Grenada | 79.1 /100 | #146 | Good 11.9% |
| Poles | 78.6 /100 | #147 | Good 11.9% |
| Italians | 77.8 /100 | #148 | Good 11.9% |
| Immigrants | Oceania | 77.7 /100 | #149 | Good 11.9% |
| Immigrants | Portugal | 77.3 /100 | #150 | Good 11.9% |
| Czechs | 76.4 /100 | #151 | Good 11.9% |
| Immigrants | Hungary | 73.7 /100 | #152 | Good 11.9% |
| Austrians | 72.2 /100 | #153 | Good 12.0% |
| Chileans | 71.3 /100 | #154 | Good 12.0% |
| Japanese | 70.9 /100 | #155 | Good 12.0% |
Demographics Similar to Seminole by Divorced or Separated
In terms of divorced or separated, the demographic groups most similar to Seminole are Bahamian (14.2%, a difference of 0.17%), Chickasaw (14.2%, a difference of 0.36%), Colville (14.2%, a difference of 0.40%), Choctaw (14.1%, a difference of 0.93%), and Creek (14.4%, a difference of 1.1%).
| Demographics | Rating | Rank | Divorced or Separated |
| Puerto Ricans | 0.0 /100 | #333 | Tragic 13.9% |
| Immigrants | Bahamas | 0.0 /100 | #334 | Tragic 13.9% |
| Dutch West Indians | 0.0 /100 | #335 | Tragic 14.0% |
| Shoshone | 0.0 /100 | #336 | Tragic 14.0% |
| Crow | 0.0 /100 | #337 | Tragic 14.1% |
| Choctaw | 0.0 /100 | #338 | Tragic 14.1% |
| Colville | 0.0 /100 | #339 | Tragic 14.2% |
| Chickasaw | 0.0 /100 | #340 | Tragic 14.2% |
| Bahamians | 0.0 /100 | #341 | Tragic 14.2% |
| Seminole | 0.0 /100 | #342 | Tragic 14.3% |
| Creek | 0.0 /100 | #343 | Tragic 14.4% |
| Cubans | 0.0 /100 | #344 | Tragic 14.5% |
| Kiowa | 0.0 /100 | #345 | Tragic 14.5% |
| Arapaho | 0.0 /100 | #346 | Tragic 14.8% |
| Immigrants | Cuba | 0.0 /100 | #347 | Tragic 15.2% |