Israeli vs Immigrants from Scotland Single Father Households
COMPARE
Israeli
Immigrants from Scotland
Single Father Households
Single Father Households Comparison
Israelis
Immigrants from Scotland
2.0%
SINGLE FATHER HOUSEHOLDS
100.0/ 100
METRIC RATING
31st/ 347
METRIC RANK
2.1%
SINGLE FATHER HOUSEHOLDS
99.8/ 100
METRIC RATING
76th/ 347
METRIC RANK
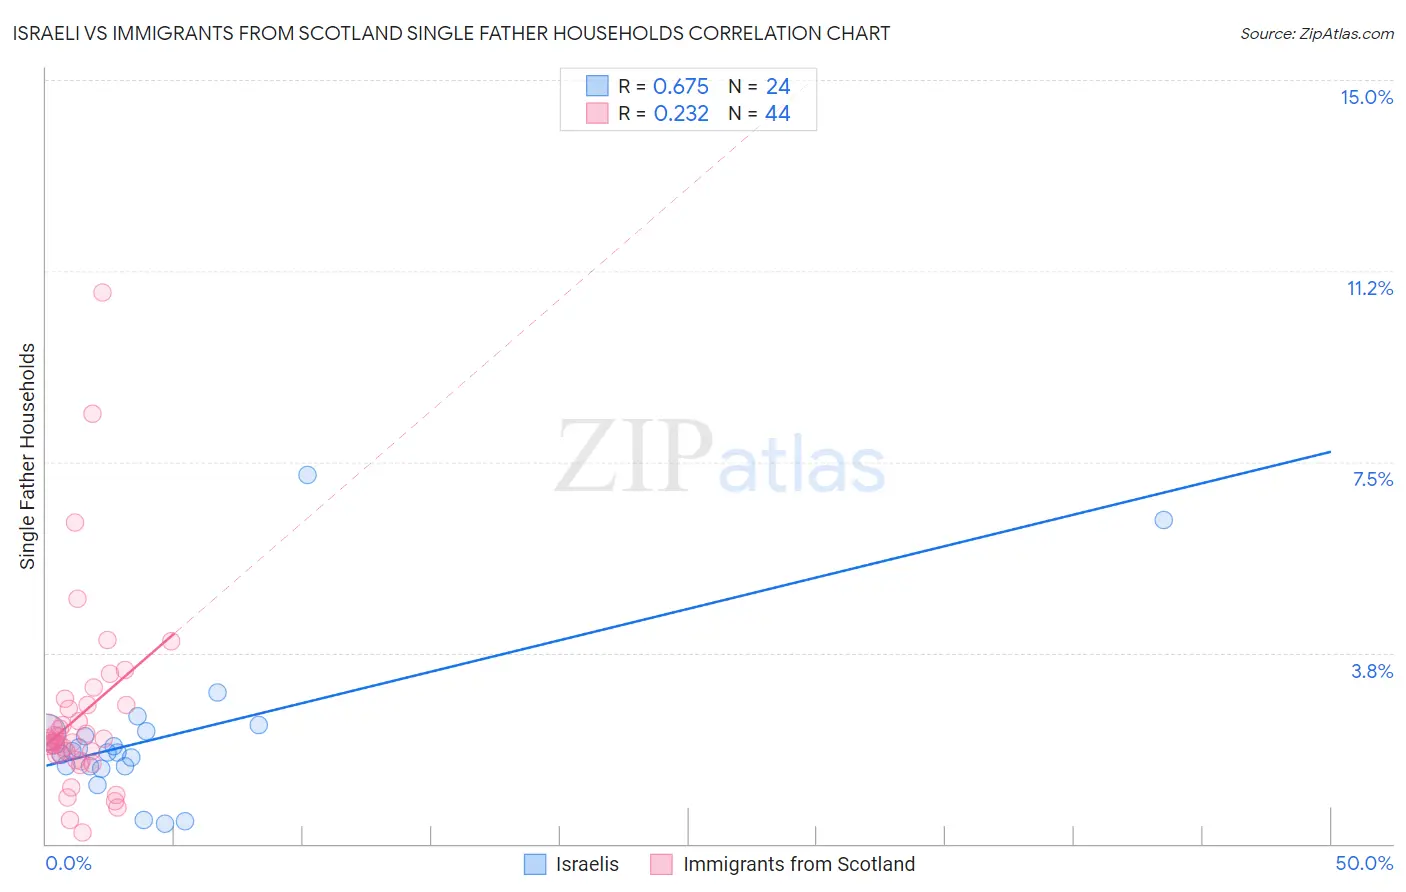
Israeli vs Immigrants from Scotland Single Father Households Correlation Chart
The statistical analysis conducted on geographies consisting of 209,705,406 people shows a significant positive correlation between the proportion of Israelis and percentage of single father households in the United States with a correlation coefficient (R) of 0.675 and weighted average of 2.0%. Similarly, the statistical analysis conducted on geographies consisting of 195,198,580 people shows a weak positive correlation between the proportion of Immigrants from Scotland and percentage of single father households in the United States with a correlation coefficient (R) of 0.232 and weighted average of 2.1%, a difference of 5.4%.
Single Father Households Correlation Summary
| Measurement | Israeli | Immigrants from Scotland |
| Minimum | 0.39% | 0.23% |
| Maximum | 7.2% | 10.8% |
| Range | 6.9% | 10.6% |
| Mean | 2.1% | 2.5% |
| Median | 1.8% | 2.0% |
| Interquartile 25% (IQ1) | 1.5% | 1.7% |
| Interquartile 75% (IQ3) | 2.2% | 2.7% |
| Interquartile Range (IQR) | 0.68% | 1.0% |
| Standard Deviation (Sample) | 1.6% | 1.9% |
| Standard Deviation (Population) | 1.5% | 1.9% |
Similar Demographics by Single Father Households
Demographics Similar to Israelis by Single Father Households
In terms of single father households, the demographic groups most similar to Israelis are Cambodian (2.0%, a difference of 0.030%), Chinese (2.0%, a difference of 0.040%), Bulgarian (2.0%, a difference of 0.050%), Immigrants from Japan (2.0%, a difference of 0.14%), and Turkish (2.0%, a difference of 0.25%).
| Demographics | Rating | Rank | Single Father Households |
| Immigrants | Russia | 100.0 /100 | #24 | Exceptional 2.0% |
| Eastern Europeans | 100.0 /100 | #25 | Exceptional 2.0% |
| Assyrians/Chaldeans/Syriacs | 100.0 /100 | #26 | Exceptional 2.0% |
| Immigrants | South Central Asia | 100.0 /100 | #27 | Exceptional 2.0% |
| Immigrants | Japan | 100.0 /100 | #28 | Exceptional 2.0% |
| Bulgarians | 100.0 /100 | #29 | Exceptional 2.0% |
| Cambodians | 100.0 /100 | #30 | Exceptional 2.0% |
| Israelis | 100.0 /100 | #31 | Exceptional 2.0% |
| Chinese | 100.0 /100 | #32 | Exceptional 2.0% |
| Turks | 100.0 /100 | #33 | Exceptional 2.0% |
| Immigrants | Australia | 100.0 /100 | #34 | Exceptional 2.0% |
| Albanians | 100.0 /100 | #35 | Exceptional 2.0% |
| Immigrants | Belgium | 100.0 /100 | #36 | Exceptional 2.0% |
| Immigrants | St. Vincent and the Grenadines | 100.0 /100 | #37 | Exceptional 2.0% |
| Immigrants | Eastern Europe | 100.0 /100 | #38 | Exceptional 2.0% |
Demographics Similar to Immigrants from Scotland by Single Father Households
In terms of single father households, the demographic groups most similar to Immigrants from Scotland are Immigrants from Sweden (2.1%, a difference of 0.010%), Immigrants from Saudi Arabia (2.1%, a difference of 0.030%), Immigrants from Bangladesh (2.1%, a difference of 0.30%), Immigrants from Egypt (2.1%, a difference of 0.30%), and Estonian (2.1%, a difference of 0.34%).
| Demographics | Rating | Rank | Single Father Households |
| Immigrants | Romania | 99.8 /100 | #69 | Exceptional 2.1% |
| Egyptians | 99.8 /100 | #70 | Exceptional 2.1% |
| Immigrants | Kuwait | 99.8 /100 | #71 | Exceptional 2.1% |
| Immigrants | Spain | 99.8 /100 | #72 | Exceptional 2.1% |
| Immigrants | Bangladesh | 99.8 /100 | #73 | Exceptional 2.1% |
| Immigrants | Egypt | 99.8 /100 | #74 | Exceptional 2.1% |
| Immigrants | Sweden | 99.8 /100 | #75 | Exceptional 2.1% |
| Immigrants | Scotland | 99.8 /100 | #76 | Exceptional 2.1% |
| Immigrants | Saudi Arabia | 99.8 /100 | #77 | Exceptional 2.1% |
| Estonians | 99.7 /100 | #78 | Exceptional 2.1% |
| Immigrants | Asia | 99.7 /100 | #79 | Exceptional 2.1% |
| Immigrants | South Africa | 99.7 /100 | #80 | Exceptional 2.1% |
| Armenians | 99.7 /100 | #81 | Exceptional 2.1% |
| New Zealanders | 99.7 /100 | #82 | Exceptional 2.1% |
| Greeks | 99.7 /100 | #83 | Exceptional 2.1% |