Israeli vs Immigrants from Fiji Single Father Households
COMPARE
Israeli
Immigrants from Fiji
Single Father Households
Single Father Households Comparison
Israelis
Immigrants from Fiji
2.0%
SINGLE FATHER HOUSEHOLDS
100.0/ 100
METRIC RATING
31st/ 347
METRIC RANK
2.7%
SINGLE FATHER HOUSEHOLDS
0.0/ 100
METRIC RATING
293rd/ 347
METRIC RANK
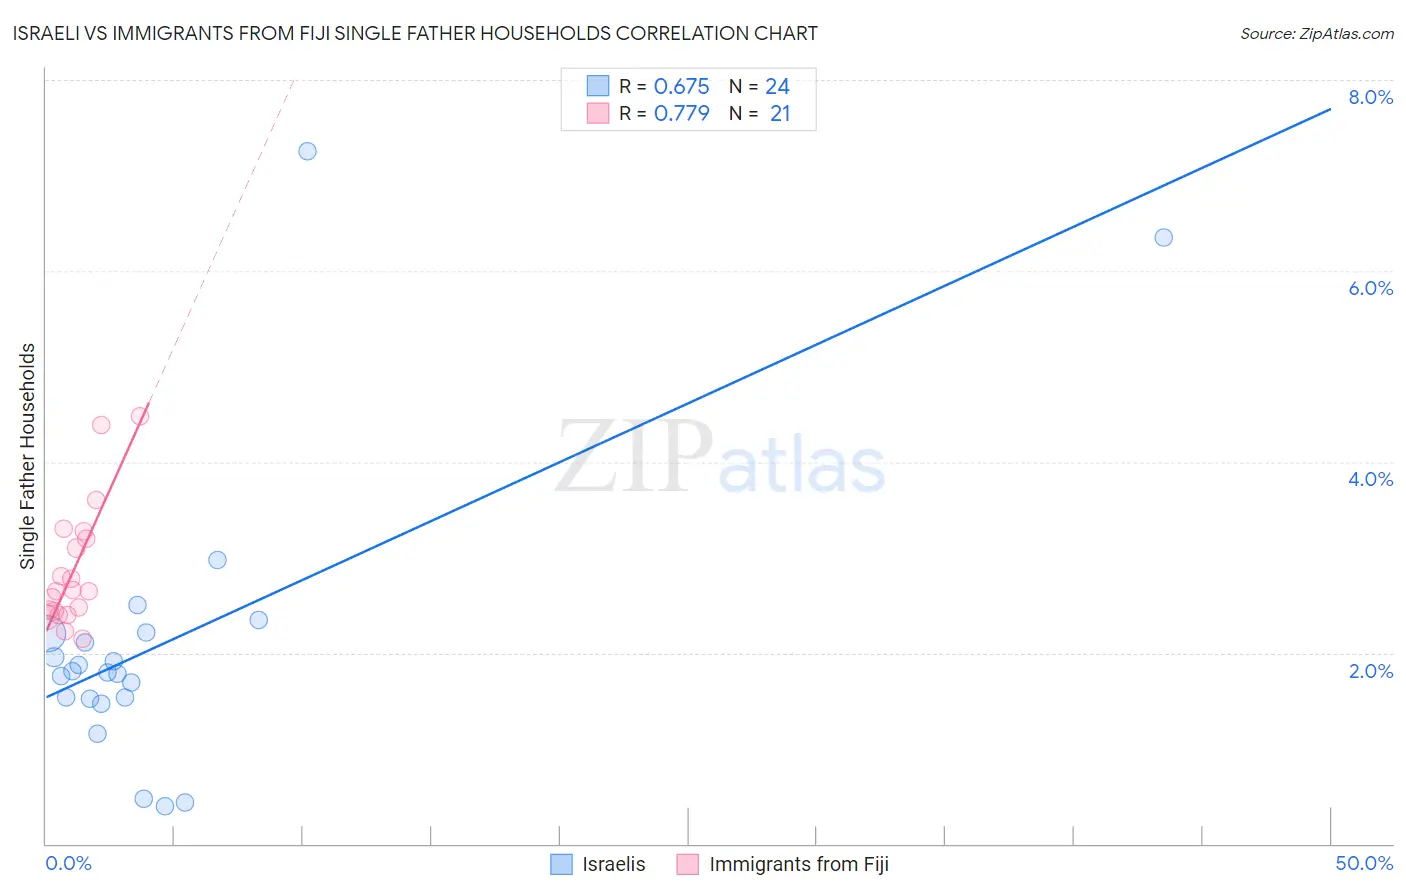
Israeli vs Immigrants from Fiji Single Father Households Correlation Chart
The statistical analysis conducted on geographies consisting of 209,705,406 people shows a significant positive correlation between the proportion of Israelis and percentage of single father households in the United States with a correlation coefficient (R) of 0.675 and weighted average of 2.0%. Similarly, the statistical analysis conducted on geographies consisting of 93,616,841 people shows a strong positive correlation between the proportion of Immigrants from Fiji and percentage of single father households in the United States with a correlation coefficient (R) of 0.779 and weighted average of 2.7%, a difference of 37.9%.
Single Father Households Correlation Summary
| Measurement | Israeli | Immigrants from Fiji |
| Minimum | 0.39% | 2.1% |
| Maximum | 7.2% | 4.5% |
| Range | 6.9% | 2.3% |
| Mean | 2.1% | 2.9% |
| Median | 1.8% | 2.6% |
| Interquartile 25% (IQ1) | 1.5% | 2.4% |
| Interquartile 75% (IQ3) | 2.2% | 3.2% |
| Interquartile Range (IQR) | 0.68% | 0.81% |
| Standard Deviation (Sample) | 1.6% | 0.64% |
| Standard Deviation (Population) | 1.5% | 0.63% |
Similar Demographics by Single Father Households
Demographics Similar to Israelis by Single Father Households
In terms of single father households, the demographic groups most similar to Israelis are Cambodian (2.0%, a difference of 0.030%), Chinese (2.0%, a difference of 0.040%), Bulgarian (2.0%, a difference of 0.050%), Immigrants from Japan (2.0%, a difference of 0.14%), and Turkish (2.0%, a difference of 0.25%).
| Demographics | Rating | Rank | Single Father Households |
| Immigrants | Russia | 100.0 /100 | #24 | Exceptional 2.0% |
| Eastern Europeans | 100.0 /100 | #25 | Exceptional 2.0% |
| Assyrians/Chaldeans/Syriacs | 100.0 /100 | #26 | Exceptional 2.0% |
| Immigrants | South Central Asia | 100.0 /100 | #27 | Exceptional 2.0% |
| Immigrants | Japan | 100.0 /100 | #28 | Exceptional 2.0% |
| Bulgarians | 100.0 /100 | #29 | Exceptional 2.0% |
| Cambodians | 100.0 /100 | #30 | Exceptional 2.0% |
| Israelis | 100.0 /100 | #31 | Exceptional 2.0% |
| Chinese | 100.0 /100 | #32 | Exceptional 2.0% |
| Turks | 100.0 /100 | #33 | Exceptional 2.0% |
| Immigrants | Australia | 100.0 /100 | #34 | Exceptional 2.0% |
| Albanians | 100.0 /100 | #35 | Exceptional 2.0% |
| Immigrants | Belgium | 100.0 /100 | #36 | Exceptional 2.0% |
| Immigrants | St. Vincent and the Grenadines | 100.0 /100 | #37 | Exceptional 2.0% |
| Immigrants | Eastern Europe | 100.0 /100 | #38 | Exceptional 2.0% |
Demographics Similar to Immigrants from Fiji by Single Father Households
In terms of single father households, the demographic groups most similar to Immigrants from Fiji are Choctaw (2.7%, a difference of 0.16%), Malaysian (2.7%, a difference of 0.43%), Blackfeet (2.7%, a difference of 0.62%), Puget Sound Salish (2.7%, a difference of 1.2%), and Chickasaw (2.8%, a difference of 1.2%).
| Demographics | Rating | Rank | Single Father Households |
| Immigrants | Cuba | 0.1 /100 | #286 | Tragic 2.7% |
| Central American Indians | 0.0 /100 | #287 | Tragic 2.7% |
| Immigrants | Cambodia | 0.0 /100 | #288 | Tragic 2.7% |
| Tlingit-Haida | 0.0 /100 | #289 | Tragic 2.7% |
| Puget Sound Salish | 0.0 /100 | #290 | Tragic 2.7% |
| Blackfeet | 0.0 /100 | #291 | Tragic 2.7% |
| Choctaw | 0.0 /100 | #292 | Tragic 2.7% |
| Immigrants | Fiji | 0.0 /100 | #293 | Tragic 2.7% |
| Malaysians | 0.0 /100 | #294 | Tragic 2.7% |
| Chickasaw | 0.0 /100 | #295 | Tragic 2.8% |
| Japanese | 0.0 /100 | #296 | Tragic 2.8% |
| Hondurans | 0.0 /100 | #297 | Tragic 2.8% |
| Cree | 0.0 /100 | #298 | Tragic 2.8% |
| Lumbee | 0.0 /100 | #299 | Tragic 2.8% |
| Kiowa | 0.0 /100 | #300 | Tragic 2.8% |