Indonesian vs Tohono O'odham Births to Unmarried Women
COMPARE
Indonesian
Tohono O'odham
Births to Unmarried Women
Births to Unmarried Women Comparison
Indonesians
Tohono O'odham
35.0%
BIRTHS TO UNMARRIED WOMEN
1.2/ 100
METRIC RATING
242nd/ 347
METRIC RANK
49.8%
BIRTHS TO UNMARRIED WOMEN
0.0/ 100
METRIC RATING
340th/ 347
METRIC RANK
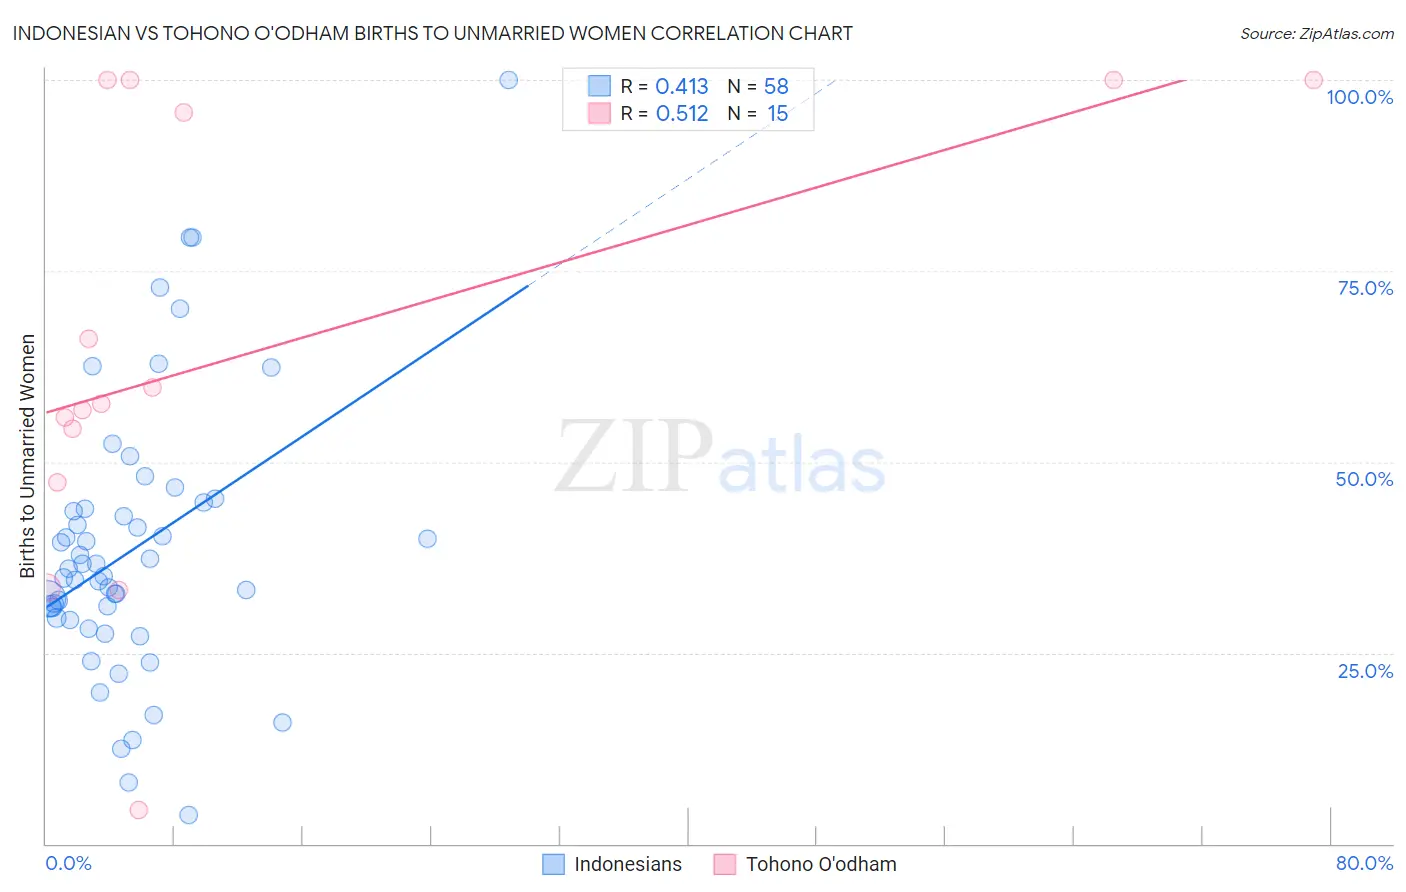
Indonesian vs Tohono O'odham Births to Unmarried Women Correlation Chart
The statistical analysis conducted on geographies consisting of 158,009,570 people shows a moderate positive correlation between the proportion of Indonesians and percentage of births to unmarried women in the United States with a correlation coefficient (R) of 0.413 and weighted average of 35.0%. Similarly, the statistical analysis conducted on geographies consisting of 58,143,081 people shows a substantial positive correlation between the proportion of Tohono O'odham and percentage of births to unmarried women in the United States with a correlation coefficient (R) of 0.512 and weighted average of 49.8%, a difference of 42.5%.
Births to Unmarried Women Correlation Summary
| Measurement | Indonesian | Tohono O'odham |
| Minimum | 3.8% | 4.5% |
| Maximum | 100.0% | 100.0% |
| Range | 96.2% | 95.5% |
| Mean | 38.6% | 64.3% |
| Median | 35.5% | 57.6% |
| Interquartile 25% (IQ1) | 29.6% | 47.3% |
| Interquartile 75% (IQ3) | 43.8% | 100.0% |
| Interquartile Range (IQR) | 14.2% | 52.7% |
| Standard Deviation (Sample) | 17.8% | 29.5% |
| Standard Deviation (Population) | 17.7% | 28.5% |
Similar Demographics by Births to Unmarried Women
Demographics Similar to Indonesians by Births to Unmarried Women
In terms of births to unmarried women, the demographic groups most similar to Indonesians are Immigrants from Guyana (35.0%, a difference of 0.10%), Immigrants from Middle Africa (34.9%, a difference of 0.13%), Sierra Leonean (34.9%, a difference of 0.38%), Japanese (35.2%, a difference of 0.49%), and Guyanese (35.2%, a difference of 0.55%).
| Demographics | Rating | Rank | Births to Unmarried Women |
| Immigrants | Ghana | 2.2 /100 | #235 | Tragic 34.5% |
| Immigrants | Cameroon | 1.6 /100 | #236 | Tragic 34.7% |
| Marshallese | 1.6 /100 | #237 | Tragic 34.8% |
| Immigrants | Cambodia | 1.6 /100 | #238 | Tragic 34.8% |
| Sierra Leoneans | 1.4 /100 | #239 | Tragic 34.9% |
| Immigrants | Middle Africa | 1.2 /100 | #240 | Tragic 34.9% |
| Immigrants | Guyana | 1.2 /100 | #241 | Tragic 35.0% |
| Indonesians | 1.2 /100 | #242 | Tragic 35.0% |
| Japanese | 0.9 /100 | #243 | Tragic 35.2% |
| Guyanese | 0.9 /100 | #244 | Tragic 35.2% |
| Shoshone | 0.8 /100 | #245 | Tragic 35.3% |
| Nigerians | 0.7 /100 | #246 | Tragic 35.3% |
| Immigrants | Nigeria | 0.7 /100 | #247 | Tragic 35.4% |
| Immigrants | Nonimmigrants | 0.6 /100 | #248 | Tragic 35.5% |
| Bermudans | 0.6 /100 | #249 | Tragic 35.5% |
Demographics Similar to Tohono O'odham by Births to Unmarried Women
In terms of births to unmarried women, the demographic groups most similar to Tohono O'odham are Hopi (50.8%, a difference of 1.9%), Menominee (51.1%, a difference of 2.5%), Pima (51.5%, a difference of 3.3%), Navajo (51.5%, a difference of 3.3%), and Lumbee (48.2%, a difference of 3.4%).
| Demographics | Rating | Rank | Births to Unmarried Women |
| Blacks/African Americans | 0.0 /100 | #333 | Tragic 44.3% |
| Yuman | 0.0 /100 | #334 | Tragic 44.4% |
| Colville | 0.0 /100 | #335 | Tragic 45.3% |
| Puerto Ricans | 0.0 /100 | #336 | Tragic 45.7% |
| Houma | 0.0 /100 | #337 | Tragic 46.6% |
| Arapaho | 0.0 /100 | #338 | Tragic 47.1% |
| Lumbee | 0.0 /100 | #339 | Tragic 48.2% |
| Tohono O'odham | 0.0 /100 | #340 | Tragic 49.8% |
| Hopi | 0.0 /100 | #341 | Tragic 50.8% |
| Menominee | 0.0 /100 | #342 | Tragic 51.1% |
| Pima | 0.0 /100 | #343 | Tragic 51.5% |
| Navajo | 0.0 /100 | #344 | Tragic 51.5% |
| Inupiat | 0.0 /100 | #345 | Tragic 52.1% |
| Pueblo | 0.0 /100 | #346 | Tragic 53.7% |
| Yup'ik | 0.0 /100 | #347 | Tragic 56.4% |