Indonesian vs Immigrants from Eastern Africa Births to Unmarried Women
COMPARE
Indonesian
Immigrants from Eastern Africa
Births to Unmarried Women
Births to Unmarried Women Comparison
Indonesians
Immigrants from Eastern Africa
35.0%
BIRTHS TO UNMARRIED WOMEN
1.2/ 100
METRIC RATING
242nd/ 347
METRIC RANK
31.0%
BIRTHS TO UNMARRIED WOMEN
72.1/ 100
METRIC RATING
157th/ 347
METRIC RANK
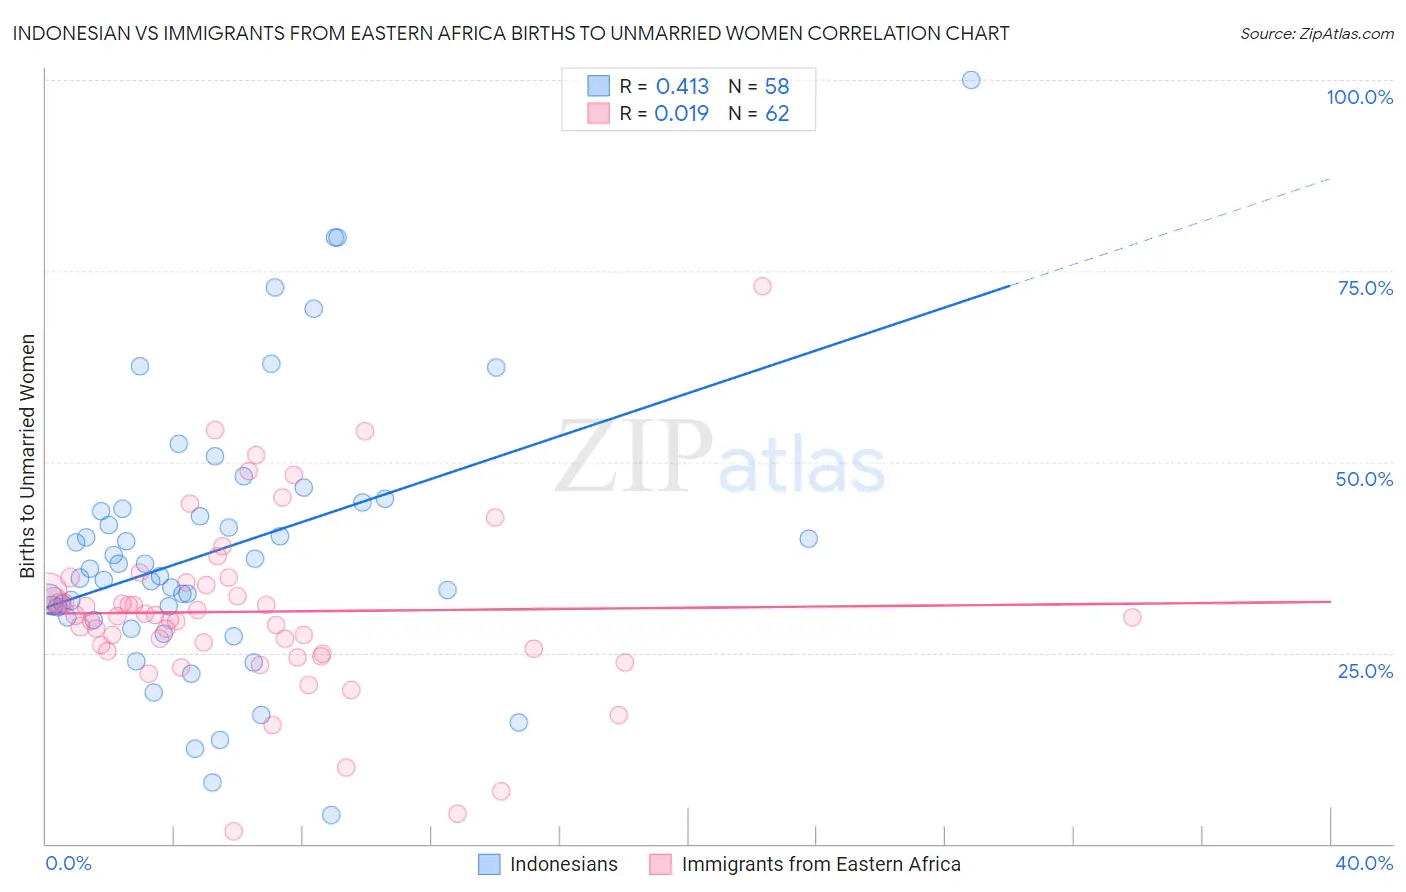
Indonesian vs Immigrants from Eastern Africa Births to Unmarried Women Correlation Chart
The statistical analysis conducted on geographies consisting of 158,009,570 people shows a moderate positive correlation between the proportion of Indonesians and percentage of births to unmarried women in the United States with a correlation coefficient (R) of 0.413 and weighted average of 35.0%. Similarly, the statistical analysis conducted on geographies consisting of 336,393,079 people shows no correlation between the proportion of Immigrants from Eastern Africa and percentage of births to unmarried women in the United States with a correlation coefficient (R) of 0.019 and weighted average of 31.0%, a difference of 13.0%.
Births to Unmarried Women Correlation Summary
| Measurement | Indonesian | Immigrants from Eastern Africa |
| Minimum | 3.8% | 1.6% |
| Maximum | 100.0% | 73.0% |
| Range | 96.2% | 71.4% |
| Mean | 38.6% | 30.4% |
| Median | 35.5% | 29.8% |
| Interquartile 25% (IQ1) | 29.6% | 25.2% |
| Interquartile 75% (IQ3) | 43.8% | 33.8% |
| Interquartile Range (IQR) | 14.2% | 8.6% |
| Standard Deviation (Sample) | 17.8% | 11.7% |
| Standard Deviation (Population) | 17.7% | 11.6% |
Similar Demographics by Births to Unmarried Women
Demographics Similar to Indonesians by Births to Unmarried Women
In terms of births to unmarried women, the demographic groups most similar to Indonesians are Immigrants from Guyana (35.0%, a difference of 0.10%), Immigrants from Middle Africa (34.9%, a difference of 0.13%), Sierra Leonean (34.9%, a difference of 0.38%), Japanese (35.2%, a difference of 0.49%), and Guyanese (35.2%, a difference of 0.55%).
| Demographics | Rating | Rank | Births to Unmarried Women |
| Immigrants | Ghana | 2.2 /100 | #235 | Tragic 34.5% |
| Immigrants | Cameroon | 1.6 /100 | #236 | Tragic 34.7% |
| Marshallese | 1.6 /100 | #237 | Tragic 34.8% |
| Immigrants | Cambodia | 1.6 /100 | #238 | Tragic 34.8% |
| Sierra Leoneans | 1.4 /100 | #239 | Tragic 34.9% |
| Immigrants | Middle Africa | 1.2 /100 | #240 | Tragic 34.9% |
| Immigrants | Guyana | 1.2 /100 | #241 | Tragic 35.0% |
| Indonesians | 1.2 /100 | #242 | Tragic 35.0% |
| Japanese | 0.9 /100 | #243 | Tragic 35.2% |
| Guyanese | 0.9 /100 | #244 | Tragic 35.2% |
| Shoshone | 0.8 /100 | #245 | Tragic 35.3% |
| Nigerians | 0.7 /100 | #246 | Tragic 35.3% |
| Immigrants | Nigeria | 0.7 /100 | #247 | Tragic 35.4% |
| Immigrants | Nonimmigrants | 0.6 /100 | #248 | Tragic 35.5% |
| Bermudans | 0.6 /100 | #249 | Tragic 35.5% |
Demographics Similar to Immigrants from Eastern Africa by Births to Unmarried Women
In terms of births to unmarried women, the demographic groups most similar to Immigrants from Eastern Africa are Carpatho Rusyn (30.9%, a difference of 0.17%), Immigrants from Bangladesh (30.9%, a difference of 0.22%), Austrian (31.0%, a difference of 0.27%), Immigrants from England (31.1%, a difference of 0.32%), and Immigrants from Western Europe (31.1%, a difference of 0.33%).
| Demographics | Rating | Rank | Births to Unmarried Women |
| Somalis | 77.8 /100 | #150 | Good 30.7% |
| Italians | 77.0 /100 | #151 | Good 30.8% |
| Poles | 76.2 /100 | #152 | Good 30.8% |
| British | 76.0 /100 | #153 | Good 30.8% |
| Yugoslavians | 75.1 /100 | #154 | Good 30.8% |
| Immigrants | Bangladesh | 73.9 /100 | #155 | Good 30.9% |
| Carpatho Rusyns | 73.5 /100 | #156 | Good 30.9% |
| Immigrants | Eastern Africa | 72.1 /100 | #157 | Good 31.0% |
| Austrians | 69.9 /100 | #158 | Good 31.0% |
| Immigrants | England | 69.4 /100 | #159 | Good 31.1% |
| Immigrants | Western Europe | 69.3 /100 | #160 | Good 31.1% |
| Immigrants | Southern Europe | 68.7 /100 | #161 | Good 31.1% |
| Slovenes | 65.9 /100 | #162 | Good 31.2% |
| Immigrants | Chile | 65.7 /100 | #163 | Good 31.2% |
| Hungarians | 64.1 /100 | #164 | Good 31.2% |