Immigrants vs Immigrants from El Salvador Single Father Households
COMPARE
Immigrants
Immigrants from El Salvador
Single Father Households
Single Father Households Comparison
Immigrants
Immigrants from El Salvador
2.5%
SINGLE FATHER HOUSEHOLDS
6.3/ 100
METRIC RATING
235th/ 347
METRIC RANK
2.9%
SINGLE FATHER HOUSEHOLDS
0.0/ 100
METRIC RATING
317th/ 347
METRIC RANK
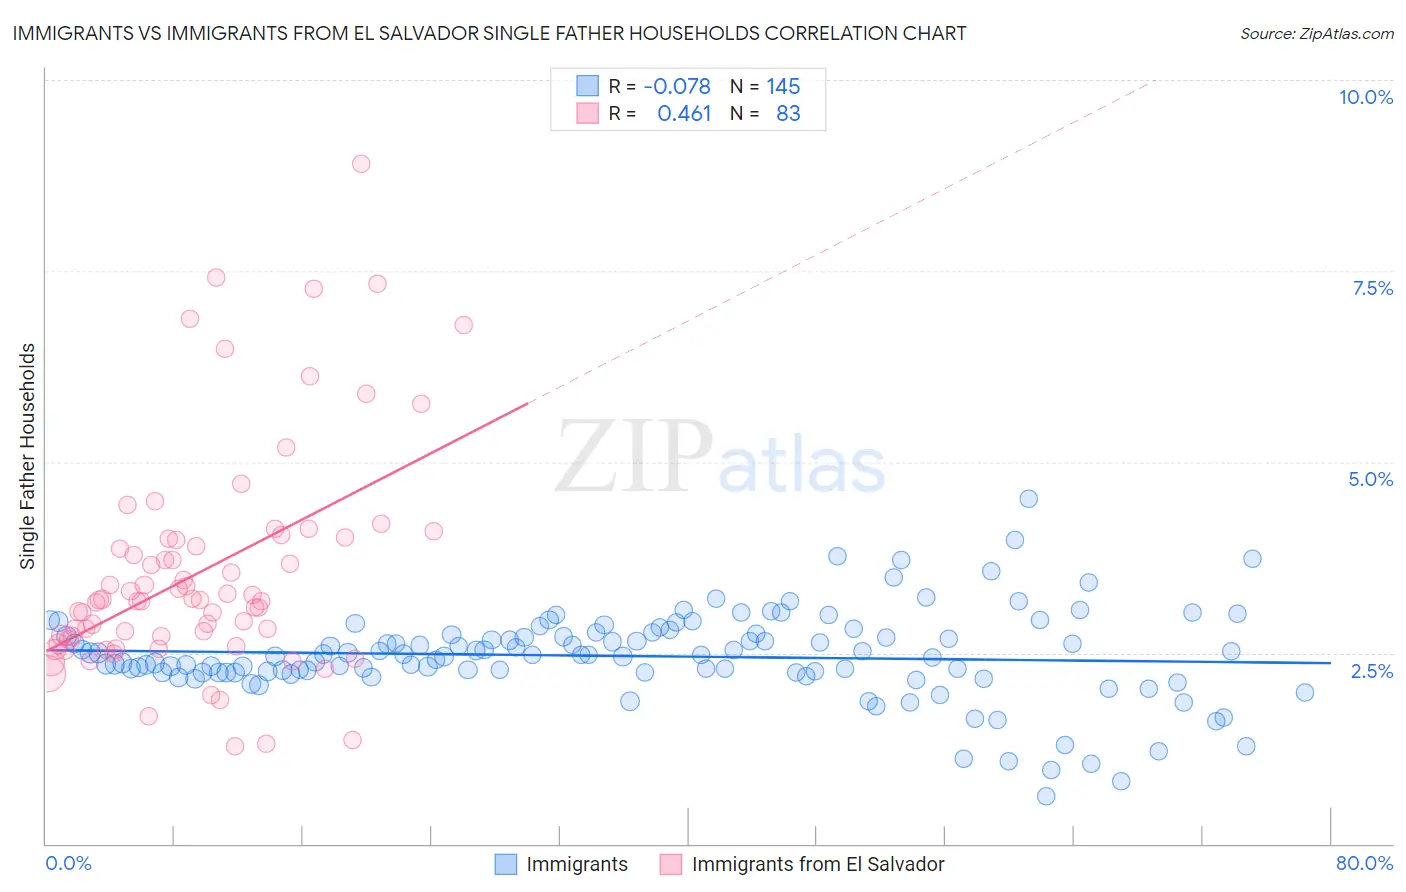
Immigrants vs Immigrants from El Salvador Single Father Households Correlation Chart
The statistical analysis conducted on geographies consisting of 561,636,602 people shows a slight negative correlation between the proportion of Immigrants and percentage of single father households in the United States with a correlation coefficient (R) of -0.078 and weighted average of 2.5%. Similarly, the statistical analysis conducted on geographies consisting of 355,655,401 people shows a moderate positive correlation between the proportion of Immigrants from El Salvador and percentage of single father households in the United States with a correlation coefficient (R) of 0.461 and weighted average of 2.9%, a difference of 20.0%.
Single Father Households Correlation Summary
| Measurement | Immigrants | Immigrants from El Salvador |
| Minimum | 0.62% | 1.3% |
| Maximum | 4.5% | 8.9% |
| Range | 3.9% | 7.6% |
| Mean | 2.5% | 3.6% |
| Median | 2.5% | 3.2% |
| Interquartile 25% (IQ1) | 2.2% | 2.7% |
| Interquartile 75% (IQ3) | 2.7% | 4.0% |
| Interquartile Range (IQR) | 0.49% | 1.3% |
| Standard Deviation (Sample) | 0.58% | 1.5% |
| Standard Deviation (Population) | 0.58% | 1.5% |
Similar Demographics by Single Father Households
Demographics Similar to Immigrants by Single Father Households
In terms of single father households, the demographic groups most similar to Immigrants are African (2.5%, a difference of 0.020%), Cajun (2.5%, a difference of 0.050%), Sierra Leonean (2.5%, a difference of 0.10%), Immigrants from Sierra Leone (2.5%, a difference of 0.13%), and Immigrants from Oceania (2.5%, a difference of 0.14%).
| Demographics | Rating | Rank | Single Father Households |
| Immigrants | Ghana | 9.1 /100 | #228 | Tragic 2.4% |
| Immigrants | Zaire | 8.6 /100 | #229 | Tragic 2.4% |
| Sub-Saharan Africans | 8.3 /100 | #230 | Tragic 2.4% |
| Immigrants | Nonimmigrants | 7.6 /100 | #231 | Tragic 2.4% |
| Pennsylvania Germans | 7.3 /100 | #232 | Tragic 2.4% |
| Immigrants | Western Africa | 7.0 /100 | #233 | Tragic 2.4% |
| Africans | 6.3 /100 | #234 | Tragic 2.5% |
| Immigrants | Immigrants | 6.3 /100 | #235 | Tragic 2.5% |
| Cajuns | 6.1 /100 | #236 | Tragic 2.5% |
| Sierra Leoneans | 5.9 /100 | #237 | Tragic 2.5% |
| Immigrants | Sierra Leone | 5.8 /100 | #238 | Tragic 2.5% |
| Immigrants | Oceania | 5.8 /100 | #239 | Tragic 2.5% |
| Immigrants | Dominica | 4.8 /100 | #240 | Tragic 2.5% |
| Portuguese | 4.1 /100 | #241 | Tragic 2.5% |
| Osage | 4.1 /100 | #242 | Tragic 2.5% |
Demographics Similar to Immigrants from El Salvador by Single Father Households
In terms of single father households, the demographic groups most similar to Immigrants from El Salvador are Cape Verdean (2.9%, a difference of 0.010%), Ute (3.0%, a difference of 0.54%), Guatemalan (3.0%, a difference of 0.62%), Cheyenne (2.9%, a difference of 0.86%), and Houma (2.9%, a difference of 0.86%).
| Demographics | Rating | Rank | Single Father Households |
| Immigrants | Laos | 0.0 /100 | #310 | Tragic 2.9% |
| Spanish American Indians | 0.0 /100 | #311 | Tragic 2.9% |
| Tsimshian | 0.0 /100 | #312 | Tragic 2.9% |
| Arapaho | 0.0 /100 | #313 | Tragic 2.9% |
| Salvadorans | 0.0 /100 | #314 | Tragic 2.9% |
| Cheyenne | 0.0 /100 | #315 | Tragic 2.9% |
| Houma | 0.0 /100 | #316 | Tragic 2.9% |
| Immigrants | El Salvador | 0.0 /100 | #317 | Tragic 2.9% |
| Cape Verdeans | 0.0 /100 | #318 | Tragic 2.9% |
| Ute | 0.0 /100 | #319 | Tragic 3.0% |
| Guatemalans | 0.0 /100 | #320 | Tragic 3.0% |
| Mexicans | 0.0 /100 | #321 | Tragic 3.0% |
| Immigrants | Guatemala | 0.0 /100 | #322 | Tragic 3.0% |
| Immigrants | Central America | 0.0 /100 | #323 | Tragic 3.0% |
| Fijians | 0.0 /100 | #324 | Tragic 3.0% |