Immigrants from Thailand vs Bangladeshi Average Family Size
COMPARE
Immigrants from Thailand
Bangladeshi
Average Family Size
Average Family Size Comparison
Immigrants from Thailand
Bangladeshis
3.27
AVERAGE FAMILY SIZE
93.3/ 100
METRIC RATING
121st/ 347
METRIC RANK
3.37
AVERAGE FAMILY SIZE
100.0/ 100
METRIC RATING
49th/ 347
METRIC RANK
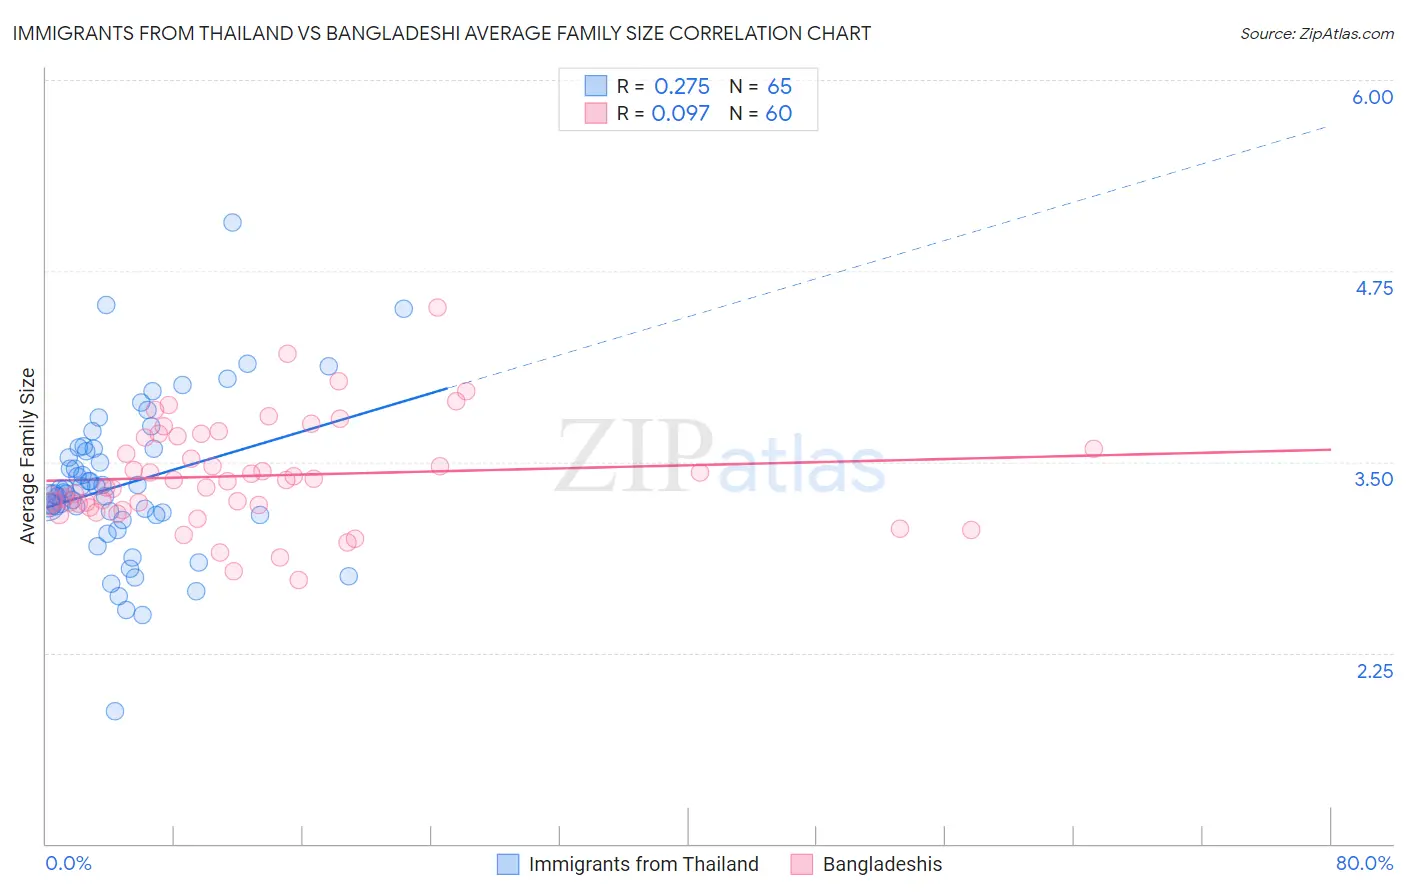
Immigrants from Thailand vs Bangladeshi Average Family Size Correlation Chart
The statistical analysis conducted on geographies consisting of 316,926,842 people shows a weak positive correlation between the proportion of Immigrants from Thailand and average family size in the United States with a correlation coefficient (R) of 0.275 and weighted average of 3.27. Similarly, the statistical analysis conducted on geographies consisting of 141,330,696 people shows a slight positive correlation between the proportion of Bangladeshis and average family size in the United States with a correlation coefficient (R) of 0.097 and weighted average of 3.37, a difference of 3.1%.
Average Family Size Correlation Summary
| Measurement | Immigrants from Thailand | Bangladeshi |
| Minimum | 1.87 | 2.73 |
| Maximum | 5.07 | 4.51 |
| Range | 3.20 | 1.78 |
| Mean | 3.35 | 3.41 |
| Median | 3.30 | 3.37 |
| Interquartile 25% (IQ1) | 3.15 | 3.21 |
| Interquartile 75% (IQ3) | 3.59 | 3.67 |
| Interquartile Range (IQR) | 0.44 | 0.46 |
| Standard Deviation (Sample) | 0.51 | 0.34 |
| Standard Deviation (Population) | 0.51 | 0.34 |
Similar Demographics by Average Family Size
Demographics Similar to Immigrants from Thailand by Average Family Size
In terms of average family size, the demographic groups most similar to Immigrants from Thailand are Immigrants from Bahamas (3.27, a difference of 0.020%), Immigrants from Colombia (3.27, a difference of 0.030%), Immigrants from Indonesia (3.27, a difference of 0.040%), Immigrants from Asia (3.27, a difference of 0.050%), and Alaskan Athabascan (3.27, a difference of 0.060%).
| Demographics | Rating | Rank | Average Family Size |
| South Americans | 95.1 /100 | #114 | Exceptional 3.27 |
| Immigrants | Liberia | 95.0 /100 | #115 | Exceptional 3.27 |
| Immigrants | South America | 95.0 /100 | #116 | Exceptional 3.27 |
| Kiowa | 94.8 /100 | #117 | Exceptional 3.27 |
| Immigrants | Asia | 94.0 /100 | #118 | Exceptional 3.27 |
| Immigrants | Indonesia | 93.7 /100 | #119 | Exceptional 3.27 |
| Immigrants | Bahamas | 93.6 /100 | #120 | Exceptional 3.27 |
| Immigrants | Thailand | 93.3 /100 | #121 | Exceptional 3.27 |
| Immigrants | Colombia | 92.8 /100 | #122 | Exceptional 3.27 |
| Alaskan Athabascans | 92.4 /100 | #123 | Exceptional 3.27 |
| South American Indians | 91.6 /100 | #124 | Exceptional 3.26 |
| Immigrants | Cuba | 91.3 /100 | #125 | Exceptional 3.26 |
| Immigrants | Costa Rica | 90.7 /100 | #126 | Exceptional 3.26 |
| Immigrants | Syria | 90.6 /100 | #127 | Exceptional 3.26 |
| Colombians | 89.9 /100 | #128 | Excellent 3.26 |
Demographics Similar to Bangladeshis by Average Family Size
In terms of average family size, the demographic groups most similar to Bangladeshis are Immigrants from Nicaragua (3.37, a difference of 0.060%), Vietnamese (3.37, a difference of 0.070%), Haitian (3.37, a difference of 0.11%), Immigrants from Bangladesh (3.36, a difference of 0.14%), and Shoshone (3.37, a difference of 0.16%).
| Demographics | Rating | Rank | Average Family Size |
| Immigrants | Vietnam | 100.0 /100 | #42 | Exceptional 3.38 |
| Immigrants | Philippines | 100.0 /100 | #43 | Exceptional 3.37 |
| Alaska Natives | 100.0 /100 | #44 | Exceptional 3.37 |
| Shoshone | 100.0 /100 | #45 | Exceptional 3.37 |
| Haitians | 100.0 /100 | #46 | Exceptional 3.37 |
| Vietnamese | 100.0 /100 | #47 | Exceptional 3.37 |
| Immigrants | Nicaragua | 100.0 /100 | #48 | Exceptional 3.37 |
| Bangladeshis | 100.0 /100 | #49 | Exceptional 3.37 |
| Immigrants | Bangladesh | 100.0 /100 | #50 | Exceptional 3.36 |
| Nicaraguans | 100.0 /100 | #51 | Exceptional 3.36 |
| Fijians | 100.0 /100 | #52 | Exceptional 3.36 |
| Koreans | 100.0 /100 | #53 | Exceptional 3.36 |
| Immigrants | South Eastern Asia | 100.0 /100 | #54 | Exceptional 3.36 |
| Immigrants | Honduras | 100.0 /100 | #55 | Exceptional 3.36 |
| Immigrants | Dominican Republic | 100.0 /100 | #56 | Exceptional 3.35 |