Afghan vs Bangladeshi Average Family Size
COMPARE
Afghan
Bangladeshi
Average Family Size
Average Family Size Comparison
Afghans
Bangladeshis
3.31
AVERAGE FAMILY SIZE
99.7/ 100
METRIC RATING
85th/ 347
METRIC RANK
3.37
AVERAGE FAMILY SIZE
100.0/ 100
METRIC RATING
49th/ 347
METRIC RANK
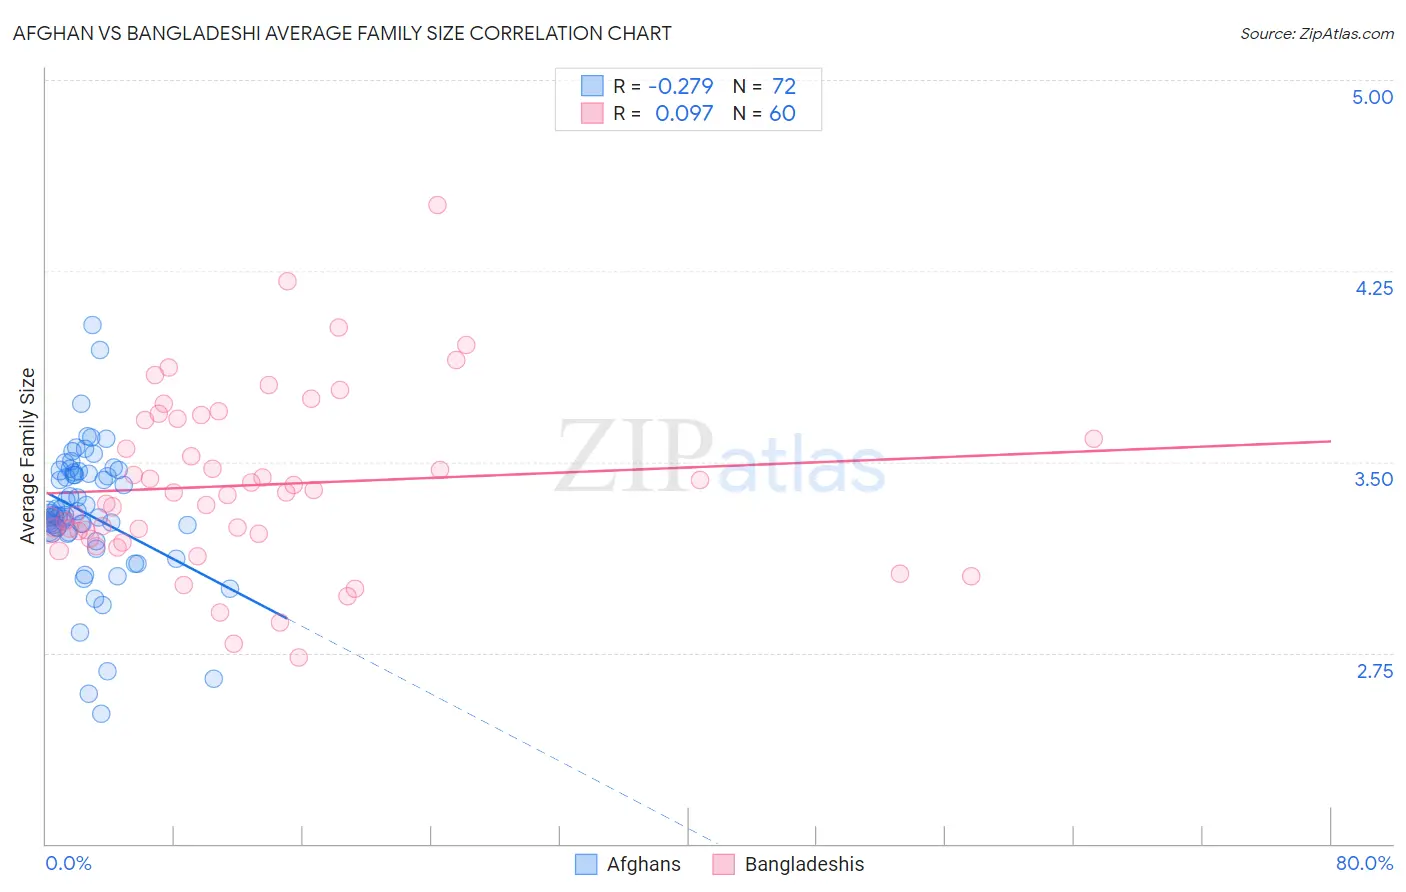
Afghan vs Bangladeshi Average Family Size Correlation Chart
The statistical analysis conducted on geographies consisting of 148,832,546 people shows a weak negative correlation between the proportion of Afghans and average family size in the United States with a correlation coefficient (R) of -0.279 and weighted average of 3.31. Similarly, the statistical analysis conducted on geographies consisting of 141,330,696 people shows a slight positive correlation between the proportion of Bangladeshis and average family size in the United States with a correlation coefficient (R) of 0.097 and weighted average of 3.37, a difference of 1.6%.
Average Family Size Correlation Summary
| Measurement | Afghan | Bangladeshi |
| Minimum | 2.51 | 2.73 |
| Maximum | 4.04 | 4.51 |
| Range | 1.53 | 1.78 |
| Mean | 3.30 | 3.41 |
| Median | 3.29 | 3.37 |
| Interquartile 25% (IQ1) | 3.22 | 3.21 |
| Interquartile 75% (IQ3) | 3.46 | 3.67 |
| Interquartile Range (IQR) | 0.23 | 0.46 |
| Standard Deviation (Sample) | 0.26 | 0.34 |
| Standard Deviation (Population) | 0.26 | 0.34 |
Similar Demographics by Average Family Size
Demographics Similar to Afghans by Average Family Size
In terms of average family size, the demographic groups most similar to Afghans are Jamaican (3.31, a difference of 0.020%), Immigrants from Nigeria (3.32, a difference of 0.040%), Immigrants from Peru (3.31, a difference of 0.070%), Immigrants from Afghanistan (3.32, a difference of 0.080%), and Ecuadorian (3.32, a difference of 0.090%).
| Demographics | Rating | Rank | Average Family Size |
| Immigrants | Micronesia | 99.8 /100 | #78 | Exceptional 3.32 |
| British West Indians | 99.8 /100 | #79 | Exceptional 3.32 |
| Lumbee | 99.8 /100 | #80 | Exceptional 3.32 |
| Immigrants | Dominica | 99.8 /100 | #81 | Exceptional 3.32 |
| Ecuadorians | 99.8 /100 | #82 | Exceptional 3.32 |
| Immigrants | Afghanistan | 99.8 /100 | #83 | Exceptional 3.32 |
| Immigrants | Nigeria | 99.7 /100 | #84 | Exceptional 3.32 |
| Afghans | 99.7 /100 | #85 | Exceptional 3.31 |
| Jamaicans | 99.7 /100 | #86 | Exceptional 3.31 |
| Immigrants | Peru | 99.7 /100 | #87 | Exceptional 3.31 |
| Immigrants | Bolivia | 99.6 /100 | #88 | Exceptional 3.31 |
| Malaysians | 99.6 /100 | #89 | Exceptional 3.31 |
| Menominee | 99.4 /100 | #90 | Exceptional 3.30 |
| Immigrants | Pakistan | 99.2 /100 | #91 | Exceptional 3.30 |
| Immigrants | Cameroon | 99.2 /100 | #92 | Exceptional 3.30 |
Demographics Similar to Bangladeshis by Average Family Size
In terms of average family size, the demographic groups most similar to Bangladeshis are Immigrants from Nicaragua (3.37, a difference of 0.060%), Vietnamese (3.37, a difference of 0.070%), Haitian (3.37, a difference of 0.11%), Immigrants from Bangladesh (3.36, a difference of 0.14%), and Shoshone (3.37, a difference of 0.16%).
| Demographics | Rating | Rank | Average Family Size |
| Immigrants | Vietnam | 100.0 /100 | #42 | Exceptional 3.38 |
| Immigrants | Philippines | 100.0 /100 | #43 | Exceptional 3.37 |
| Alaska Natives | 100.0 /100 | #44 | Exceptional 3.37 |
| Shoshone | 100.0 /100 | #45 | Exceptional 3.37 |
| Haitians | 100.0 /100 | #46 | Exceptional 3.37 |
| Vietnamese | 100.0 /100 | #47 | Exceptional 3.37 |
| Immigrants | Nicaragua | 100.0 /100 | #48 | Exceptional 3.37 |
| Bangladeshis | 100.0 /100 | #49 | Exceptional 3.37 |
| Immigrants | Bangladesh | 100.0 /100 | #50 | Exceptional 3.36 |
| Nicaraguans | 100.0 /100 | #51 | Exceptional 3.36 |
| Fijians | 100.0 /100 | #52 | Exceptional 3.36 |
| Koreans | 100.0 /100 | #53 | Exceptional 3.36 |
| Immigrants | South Eastern Asia | 100.0 /100 | #54 | Exceptional 3.36 |
| Immigrants | Honduras | 100.0 /100 | #55 | Exceptional 3.36 |
| Immigrants | Dominican Republic | 100.0 /100 | #56 | Exceptional 3.35 |