Immigrants from Taiwan vs Immigrants from Serbia Family Households
COMPARE
Immigrants from Taiwan
Immigrants from Serbia
Family Households
Family Households Comparison
Immigrants from Taiwan
Immigrants from Serbia
68.0%
FAMILY HOUSEHOLDS
100.0/ 100
METRIC RATING
18th/ 347
METRIC RANK
61.6%
FAMILY HOUSEHOLDS
0.0/ 100
METRIC RATING
322nd/ 347
METRIC RANK
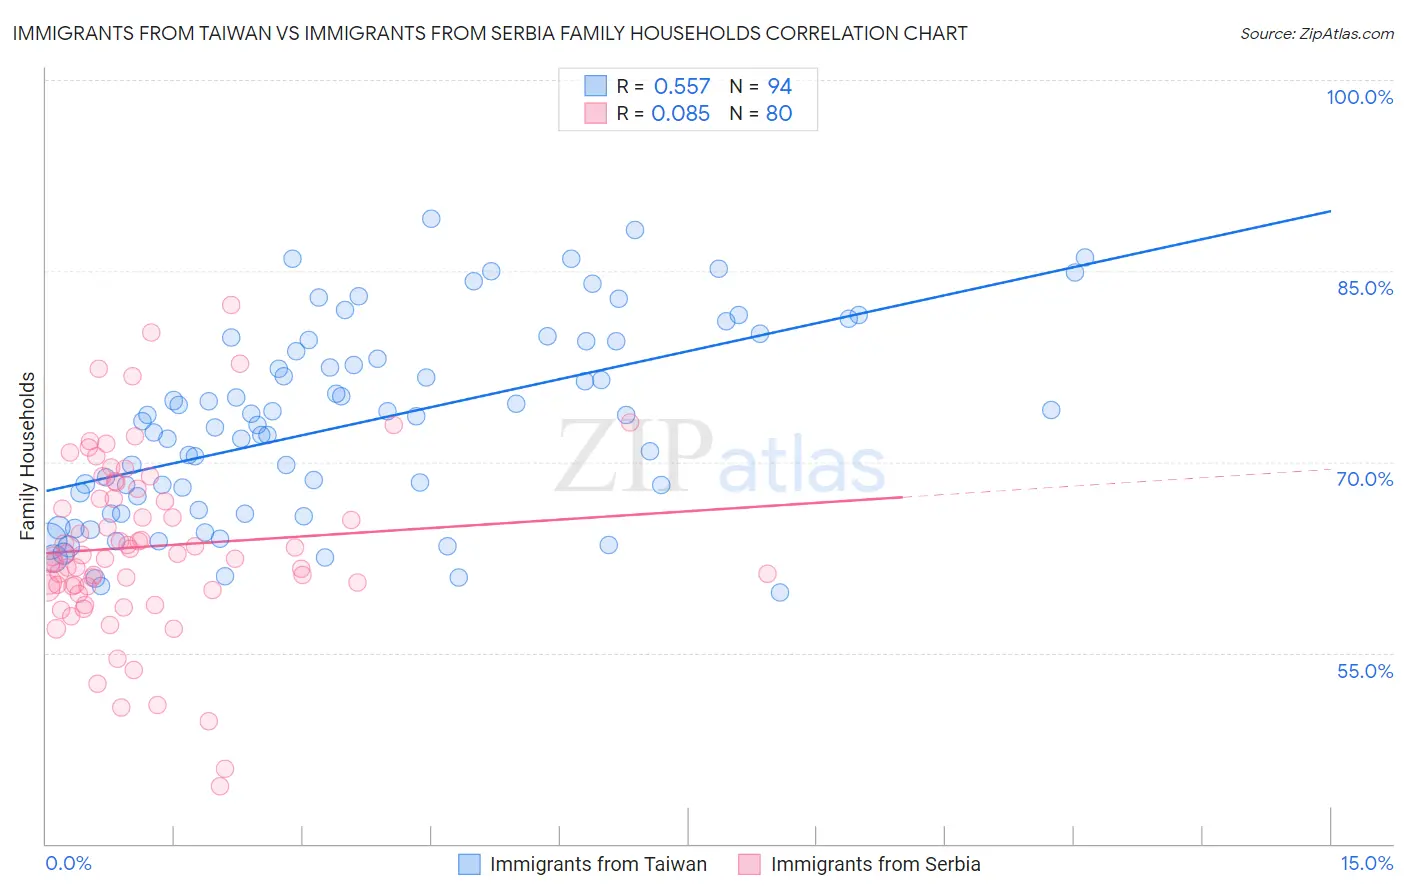
Immigrants from Taiwan vs Immigrants from Serbia Family Households Correlation Chart
The statistical analysis conducted on geographies consisting of 298,121,078 people shows a substantial positive correlation between the proportion of Immigrants from Taiwan and percentage of family households in the United States with a correlation coefficient (R) of 0.557 and weighted average of 68.0%. Similarly, the statistical analysis conducted on geographies consisting of 131,724,151 people shows a slight positive correlation between the proportion of Immigrants from Serbia and percentage of family households in the United States with a correlation coefficient (R) of 0.085 and weighted average of 61.6%, a difference of 10.4%.
Family Households Correlation Summary
| Measurement | Immigrants from Taiwan | Immigrants from Serbia |
| Minimum | 59.8% | 44.5% |
| Maximum | 89.1% | 82.3% |
| Range | 29.3% | 37.8% |
| Mean | 73.0% | 63.4% |
| Median | 73.4% | 62.6% |
| Interquartile 25% (IQ1) | 66.3% | 60.2% |
| Interquartile 75% (IQ3) | 79.4% | 67.5% |
| Interquartile Range (IQR) | 13.2% | 7.3% |
| Standard Deviation (Sample) | 7.6% | 7.0% |
| Standard Deviation (Population) | 7.5% | 7.0% |
Similar Demographics by Family Households
Demographics Similar to Immigrants from Taiwan by Family Households
In terms of family households, the demographic groups most similar to Immigrants from Taiwan are Samoan (67.9%, a difference of 0.12%), Chinese (68.1%, a difference of 0.16%), Immigrants from Vietnam (68.2%, a difference of 0.19%), Assyrian/Chaldean/Syriac (68.2%, a difference of 0.20%), and Pueblo (68.2%, a difference of 0.26%).
| Demographics | Rating | Rank | Family Households |
| Immigrants | Central America | 100.0 /100 | #11 | Exceptional 68.3% |
| Koreans | 100.0 /100 | #12 | Exceptional 68.3% |
| Pueblo | 100.0 /100 | #13 | Exceptional 68.2% |
| Immigrants | Cuba | 100.0 /100 | #14 | Exceptional 68.2% |
| Assyrians/Chaldeans/Syriacs | 100.0 /100 | #15 | Exceptional 68.2% |
| Immigrants | Vietnam | 100.0 /100 | #16 | Exceptional 68.2% |
| Chinese | 100.0 /100 | #17 | Exceptional 68.1% |
| Immigrants | Taiwan | 100.0 /100 | #18 | Exceptional 68.0% |
| Samoans | 100.0 /100 | #19 | Exceptional 67.9% |
| Inupiat | 100.0 /100 | #20 | Exceptional 67.8% |
| Cubans | 100.0 /100 | #21 | Exceptional 67.7% |
| Sri Lankans | 100.0 /100 | #22 | Exceptional 67.7% |
| Immigrants | Pakistan | 100.0 /100 | #23 | Exceptional 67.7% |
| Immigrants | South Eastern Asia | 100.0 /100 | #24 | Exceptional 67.5% |
| Immigrants | Nicaragua | 100.0 /100 | #25 | Exceptional 67.5% |
Demographics Similar to Immigrants from Serbia by Family Households
In terms of family households, the demographic groups most similar to Immigrants from Serbia are Tlingit-Haida (61.6%, a difference of 0.010%), Immigrants from West Indies (61.6%, a difference of 0.010%), Immigrants from Switzerland (61.6%, a difference of 0.020%), Alsatian (61.7%, a difference of 0.090%), and Ugandan (61.7%, a difference of 0.14%).
| Demographics | Rating | Rank | Family Households |
| Moroccans | 0.0 /100 | #315 | Tragic 61.9% |
| Immigrants | Middle Africa | 0.0 /100 | #316 | Tragic 61.9% |
| Immigrants | Bosnia and Herzegovina | 0.0 /100 | #317 | Tragic 61.9% |
| Alaskan Athabascans | 0.0 /100 | #318 | Tragic 61.8% |
| Cape Verdeans | 0.0 /100 | #319 | Tragic 61.8% |
| Ugandans | 0.0 /100 | #320 | Tragic 61.7% |
| Alsatians | 0.0 /100 | #321 | Tragic 61.7% |
| Immigrants | Serbia | 0.0 /100 | #322 | Tragic 61.6% |
| Tlingit-Haida | 0.0 /100 | #323 | Tragic 61.6% |
| Immigrants | West Indies | 0.0 /100 | #324 | Tragic 61.6% |
| Immigrants | Switzerland | 0.0 /100 | #325 | Tragic 61.6% |
| Indonesians | 0.0 /100 | #326 | Tragic 61.5% |
| Blacks/African Americans | 0.0 /100 | #327 | Tragic 61.5% |
| Kiowa | 0.0 /100 | #328 | Tragic 61.4% |
| Cambodians | 0.0 /100 | #329 | Tragic 61.4% |