Immigrants from Saudi Arabia vs Immigrants from Australia Births to Unmarried Women
COMPARE
Immigrants from Saudi Arabia
Immigrants from Australia
Births to Unmarried Women
Births to Unmarried Women Comparison
Immigrants from Saudi Arabia
Immigrants from Australia
29.1%
BIRTHS TO UNMARRIED WOMEN
97.0/ 100
METRIC RATING
89th/ 347
METRIC RANK
26.6%
BIRTHS TO UNMARRIED WOMEN
99.9/ 100
METRIC RATING
24th/ 347
METRIC RANK
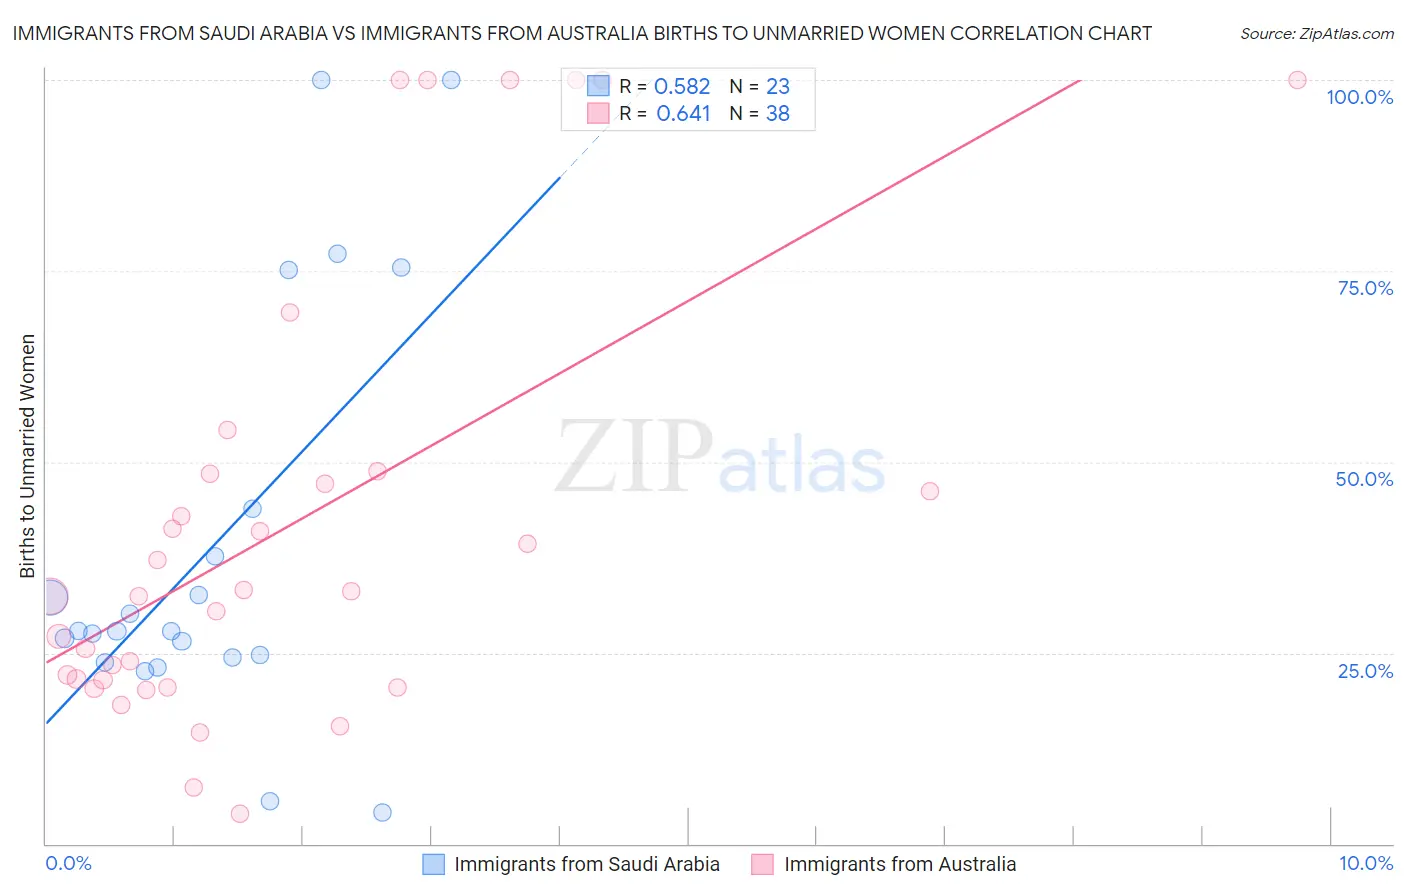
Immigrants from Saudi Arabia vs Immigrants from Australia Births to Unmarried Women Correlation Chart
The statistical analysis conducted on geographies consisting of 158,618,627 people shows a substantial positive correlation between the proportion of Immigrants from Saudi Arabia and percentage of births to unmarried women in the United States with a correlation coefficient (R) of 0.582 and weighted average of 29.1%. Similarly, the statistical analysis conducted on geographies consisting of 213,724,917 people shows a significant positive correlation between the proportion of Immigrants from Australia and percentage of births to unmarried women in the United States with a correlation coefficient (R) of 0.641 and weighted average of 26.6%, a difference of 9.2%.
Births to Unmarried Women Correlation Summary
| Measurement | Immigrants from Saudi Arabia | Immigrants from Australia |
| Minimum | 4.0% | 3.9% |
| Maximum | 100.0% | 100.0% |
| Range | 96.0% | 96.1% |
| Mean | 39.0% | 41.7% |
| Median | 27.8% | 32.7% |
| Interquartile 25% (IQ1) | 24.4% | 21.4% |
| Interquartile 75% (IQ3) | 43.8% | 48.4% |
| Interquartile Range (IQR) | 19.4% | 27.0% |
| Standard Deviation (Sample) | 27.0% | 28.8% |
| Standard Deviation (Population) | 26.4% | 28.4% |
Similar Demographics by Births to Unmarried Women
Demographics Similar to Immigrants from Saudi Arabia by Births to Unmarried Women
In terms of births to unmarried women, the demographic groups most similar to Immigrants from Saudi Arabia are Immigrants from Latvia (29.1%, a difference of 0.16%), Taiwanese (29.0%, a difference of 0.28%), Immigrants from France (29.0%, a difference of 0.28%), Immigrants from Jordan (29.0%, a difference of 0.36%), and Immigrants from Fiji (29.2%, a difference of 0.37%).
| Demographics | Rating | Rank | Births to Unmarried Women |
| Romanians | 98.0 /100 | #82 | Exceptional 28.7% |
| Immigrants | Kuwait | 98.0 /100 | #83 | Exceptional 28.8% |
| Immigrants | Poland | 97.6 /100 | #84 | Exceptional 28.9% |
| Sri Lankans | 97.5 /100 | #85 | Exceptional 28.9% |
| Immigrants | Jordan | 97.4 /100 | #86 | Exceptional 29.0% |
| Taiwanese | 97.3 /100 | #87 | Exceptional 29.0% |
| Immigrants | France | 97.3 /100 | #88 | Exceptional 29.0% |
| Immigrants | Saudi Arabia | 97.0 /100 | #89 | Exceptional 29.1% |
| Immigrants | Latvia | 96.8 /100 | #90 | Exceptional 29.1% |
| Immigrants | Fiji | 96.6 /100 | #91 | Exceptional 29.2% |
| Arabs | 96.5 /100 | #92 | Exceptional 29.2% |
| Estonians | 96.5 /100 | #93 | Exceptional 29.2% |
| Ukrainians | 96.3 /100 | #94 | Exceptional 29.2% |
| Immigrants | Vietnam | 96.1 /100 | #95 | Exceptional 29.3% |
| Norwegians | 95.8 /100 | #96 | Exceptional 29.3% |
Demographics Similar to Immigrants from Australia by Births to Unmarried Women
In terms of births to unmarried women, the demographic groups most similar to Immigrants from Australia are Cambodian (26.7%, a difference of 0.21%), Asian (26.8%, a difference of 0.61%), Immigrants from Asia (26.8%, a difference of 0.62%), Immigrants from Japan (26.4%, a difference of 0.79%), and Burmese (26.4%, a difference of 0.98%).
| Demographics | Rating | Rank | Births to Unmarried Women |
| Immigrants | Uzbekistan | 100.0 /100 | #17 | Exceptional 25.8% |
| Immigrants | Armenia | 99.9 /100 | #18 | Exceptional 26.1% |
| Armenians | 99.9 /100 | #19 | Exceptional 26.2% |
| Immigrants | Korea | 99.9 /100 | #20 | Exceptional 26.3% |
| Soviet Union | 99.9 /100 | #21 | Exceptional 26.3% |
| Burmese | 99.9 /100 | #22 | Exceptional 26.4% |
| Immigrants | Japan | 99.9 /100 | #23 | Exceptional 26.4% |
| Immigrants | Australia | 99.9 /100 | #24 | Exceptional 26.6% |
| Cambodians | 99.9 /100 | #25 | Exceptional 26.7% |
| Asians | 99.9 /100 | #26 | Exceptional 26.8% |
| Immigrants | Asia | 99.9 /100 | #27 | Exceptional 26.8% |
| Okinawans | 99.8 /100 | #28 | Exceptional 26.9% |
| Cypriots | 99.8 /100 | #29 | Exceptional 27.0% |
| Bulgarians | 99.8 /100 | #30 | Exceptional 27.1% |
| Immigrants | Iraq | 99.8 /100 | #31 | Exceptional 27.1% |