Immigrants from Middle Africa vs Immigrants from Australia Births to Unmarried Women
COMPARE
Immigrants from Middle Africa
Immigrants from Australia
Births to Unmarried Women
Births to Unmarried Women Comparison
Immigrants from Middle Africa
Immigrants from Australia
34.9%
BIRTHS TO UNMARRIED WOMEN
1.2/ 100
METRIC RATING
240th/ 347
METRIC RANK
26.6%
BIRTHS TO UNMARRIED WOMEN
99.9/ 100
METRIC RATING
24th/ 347
METRIC RANK
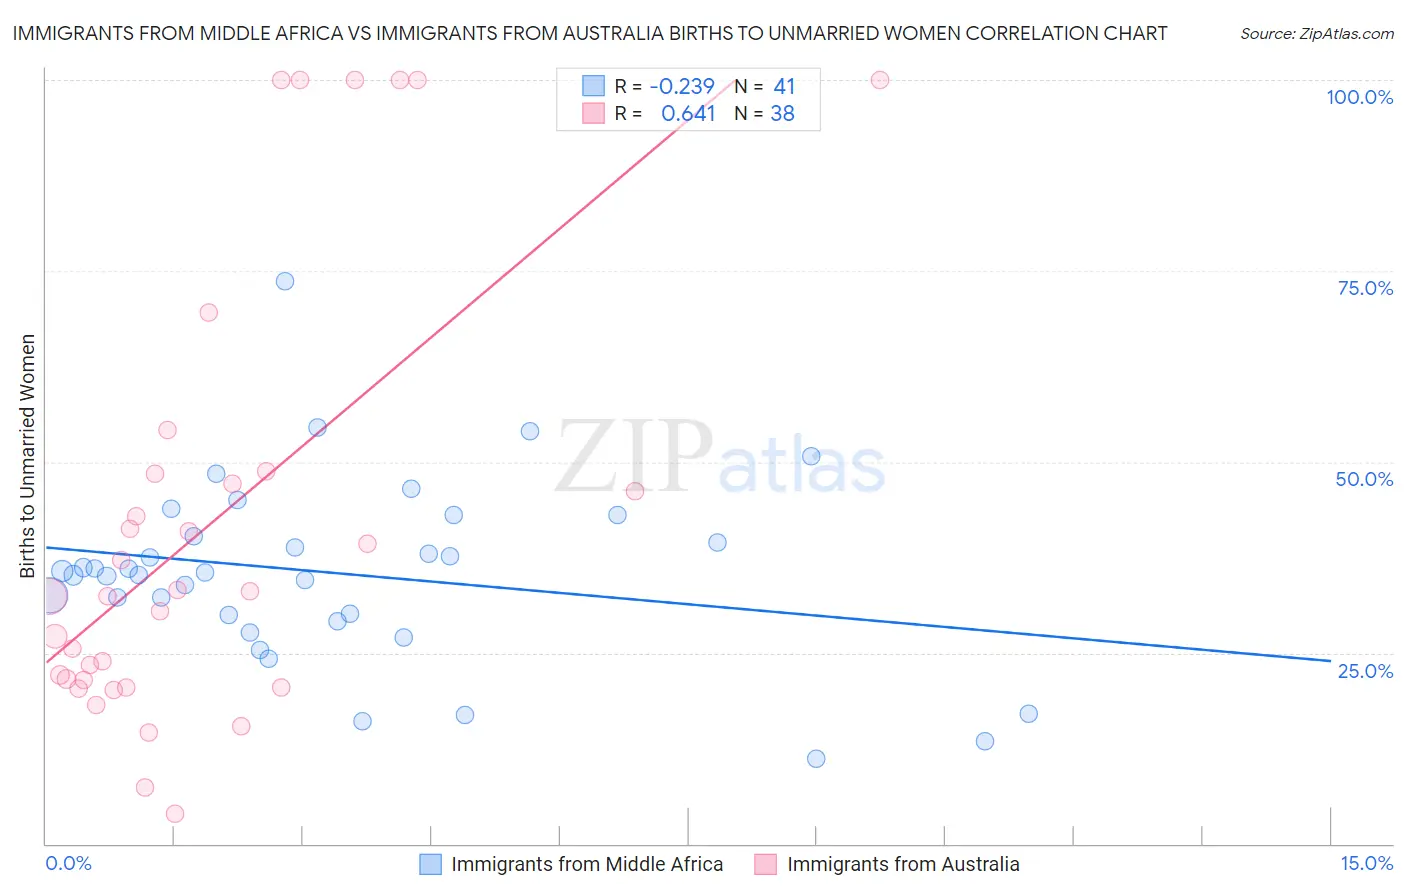
Immigrants from Middle Africa vs Immigrants from Australia Births to Unmarried Women Correlation Chart
The statistical analysis conducted on geographies consisting of 197,160,822 people shows a weak negative correlation between the proportion of Immigrants from Middle Africa and percentage of births to unmarried women in the United States with a correlation coefficient (R) of -0.239 and weighted average of 34.9%. Similarly, the statistical analysis conducted on geographies consisting of 213,724,917 people shows a significant positive correlation between the proportion of Immigrants from Australia and percentage of births to unmarried women in the United States with a correlation coefficient (R) of 0.641 and weighted average of 26.6%, a difference of 31.2%.
Births to Unmarried Women Correlation Summary
| Measurement | Immigrants from Middle Africa | Immigrants from Australia |
| Minimum | 11.1% | 3.9% |
| Maximum | 73.7% | 100.0% |
| Range | 62.6% | 96.1% |
| Mean | 35.4% | 41.7% |
| Median | 35.4% | 32.7% |
| Interquartile 25% (IQ1) | 29.5% | 21.4% |
| Interquartile 75% (IQ3) | 41.6% | 48.4% |
| Interquartile Range (IQR) | 12.1% | 27.0% |
| Standard Deviation (Sample) | 11.9% | 28.8% |
| Standard Deviation (Population) | 11.8% | 28.4% |
Similar Demographics by Births to Unmarried Women
Demographics Similar to Immigrants from Middle Africa by Births to Unmarried Women
In terms of births to unmarried women, the demographic groups most similar to Immigrants from Middle Africa are Immigrants from Guyana (35.0%, a difference of 0.030%), Indonesian (35.0%, a difference of 0.13%), Sierra Leonean (34.9%, a difference of 0.25%), Immigrants from Cambodia (34.8%, a difference of 0.47%), and Marshallese (34.8%, a difference of 0.53%).
| Demographics | Rating | Rank | Births to Unmarried Women |
| Bangladeshis | 2.5 /100 | #233 | Tragic 34.4% |
| Immigrants | Zaire | 2.3 /100 | #234 | Tragic 34.5% |
| Immigrants | Ghana | 2.2 /100 | #235 | Tragic 34.5% |
| Immigrants | Cameroon | 1.6 /100 | #236 | Tragic 34.7% |
| Marshallese | 1.6 /100 | #237 | Tragic 34.8% |
| Immigrants | Cambodia | 1.6 /100 | #238 | Tragic 34.8% |
| Sierra Leoneans | 1.4 /100 | #239 | Tragic 34.9% |
| Immigrants | Middle Africa | 1.2 /100 | #240 | Tragic 34.9% |
| Immigrants | Guyana | 1.2 /100 | #241 | Tragic 35.0% |
| Indonesians | 1.2 /100 | #242 | Tragic 35.0% |
| Japanese | 0.9 /100 | #243 | Tragic 35.2% |
| Guyanese | 0.9 /100 | #244 | Tragic 35.2% |
| Shoshone | 0.8 /100 | #245 | Tragic 35.3% |
| Nigerians | 0.7 /100 | #246 | Tragic 35.3% |
| Immigrants | Nigeria | 0.7 /100 | #247 | Tragic 35.4% |
Demographics Similar to Immigrants from Australia by Births to Unmarried Women
In terms of births to unmarried women, the demographic groups most similar to Immigrants from Australia are Cambodian (26.7%, a difference of 0.21%), Asian (26.8%, a difference of 0.61%), Immigrants from Asia (26.8%, a difference of 0.62%), Immigrants from Japan (26.4%, a difference of 0.79%), and Burmese (26.4%, a difference of 0.98%).
| Demographics | Rating | Rank | Births to Unmarried Women |
| Immigrants | Uzbekistan | 100.0 /100 | #17 | Exceptional 25.8% |
| Immigrants | Armenia | 99.9 /100 | #18 | Exceptional 26.1% |
| Armenians | 99.9 /100 | #19 | Exceptional 26.2% |
| Immigrants | Korea | 99.9 /100 | #20 | Exceptional 26.3% |
| Soviet Union | 99.9 /100 | #21 | Exceptional 26.3% |
| Burmese | 99.9 /100 | #22 | Exceptional 26.4% |
| Immigrants | Japan | 99.9 /100 | #23 | Exceptional 26.4% |
| Immigrants | Australia | 99.9 /100 | #24 | Exceptional 26.6% |
| Cambodians | 99.9 /100 | #25 | Exceptional 26.7% |
| Asians | 99.9 /100 | #26 | Exceptional 26.8% |
| Immigrants | Asia | 99.9 /100 | #27 | Exceptional 26.8% |
| Okinawans | 99.8 /100 | #28 | Exceptional 26.9% |
| Cypriots | 99.8 /100 | #29 | Exceptional 27.0% |
| Bulgarians | 99.8 /100 | #30 | Exceptional 27.1% |
| Immigrants | Iraq | 99.8 /100 | #31 | Exceptional 27.1% |