Immigrants from Poland vs Canadian Currently Married
COMPARE
Immigrants from Poland
Canadian
Currently Married
Currently Married Comparison
Immigrants from Poland
Canadians
48.1%
CURRENTLY MARRIED
96.9/ 100
METRIC RATING
80th/ 347
METRIC RANK
48.3%
CURRENTLY MARRIED
98.1/ 100
METRIC RATING
69th/ 347
METRIC RANK
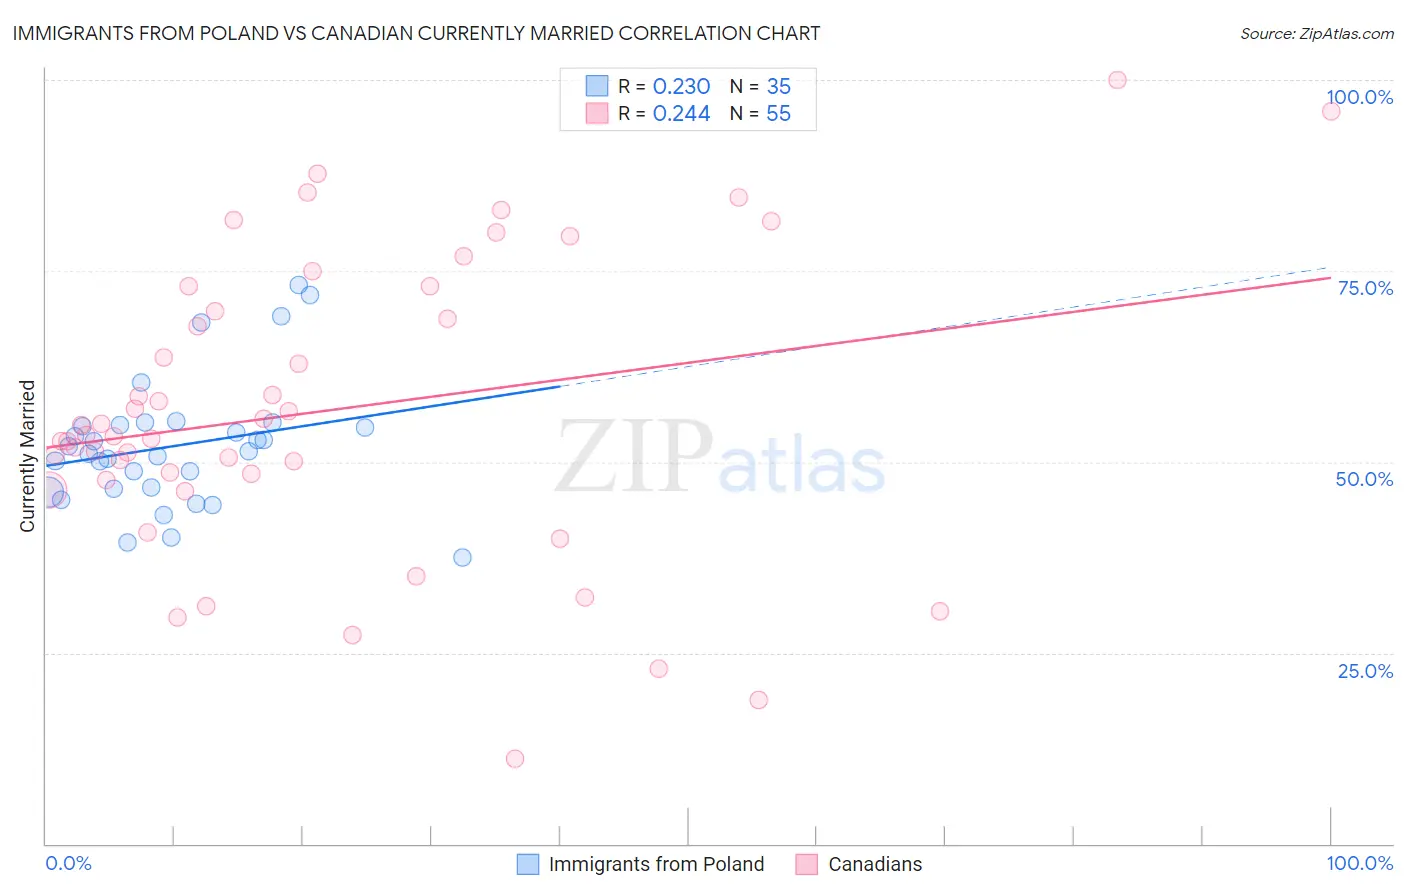
Immigrants from Poland vs Canadian Currently Married Correlation Chart
The statistical analysis conducted on geographies consisting of 304,845,419 people shows a weak positive correlation between the proportion of Immigrants from Poland and percentage of population currently married in the United States with a correlation coefficient (R) of 0.230 and weighted average of 48.1%. Similarly, the statistical analysis conducted on geographies consisting of 437,507,905 people shows a weak positive correlation between the proportion of Canadians and percentage of population currently married in the United States with a correlation coefficient (R) of 0.244 and weighted average of 48.3%, a difference of 0.46%.
Currently Married Correlation Summary
| Measurement | Immigrants from Poland | Canadian |
| Minimum | 37.5% | 11.1% |
| Maximum | 73.1% | 100.0% |
| Range | 35.6% | 88.9% |
| Mean | 52.1% | 56.8% |
| Median | 51.3% | 53.5% |
| Interquartile 25% (IQ1) | 46.5% | 47.6% |
| Interquartile 75% (IQ3) | 54.8% | 73.0% |
| Interquartile Range (IQR) | 8.3% | 25.3% |
| Standard Deviation (Sample) | 8.4% | 19.6% |
| Standard Deviation (Population) | 8.3% | 19.4% |
Demographics Similar to Immigrants from Poland and Canadians by Currently Married
In terms of currently married, the demographic groups most similar to Immigrants from Poland are Immigrants from Sri Lanka (48.1%, a difference of 0.010%), Immigrants from Europe (48.1%, a difference of 0.010%), Bolivian (48.1%, a difference of 0.010%), Immigrants from Israel (48.1%, a difference of 0.020%), and Immigrants from South Africa (48.1%, a difference of 0.030%). Similarly, the demographic groups most similar to Canadians are Slovak (48.3%, a difference of 0.020%), Immigrants from England (48.3%, a difference of 0.020%), Tongan (48.3%, a difference of 0.040%), Immigrants from Czechoslovakia (48.4%, a difference of 0.070%), and Ukrainian (48.4%, a difference of 0.070%).
| Demographics | Rating | Rank | Currently Married |
| Immigrants | Czechoslovakia | 98.3 /100 | #64 | Exceptional 48.4% |
| Ukrainians | 98.3 /100 | #65 | Exceptional 48.4% |
| Tongans | 98.2 /100 | #66 | Exceptional 48.3% |
| Slovaks | 98.2 /100 | #67 | Exceptional 48.3% |
| Immigrants | England | 98.2 /100 | #68 | Exceptional 48.3% |
| Canadians | 98.1 /100 | #69 | Exceptional 48.3% |
| Immigrants | Asia | 97.9 /100 | #70 | Exceptional 48.3% |
| Macedonians | 97.9 /100 | #71 | Exceptional 48.3% |
| Immigrants | Lebanon | 97.6 /100 | #72 | Exceptional 48.2% |
| Immigrants | Eastern Asia | 97.5 /100 | #73 | Exceptional 48.2% |
| Estonians | 97.4 /100 | #74 | Exceptional 48.2% |
| Immigrants | Belarus | 97.2 /100 | #75 | Exceptional 48.1% |
| Basques | 97.2 /100 | #76 | Exceptional 48.1% |
| Slovenes | 97.1 /100 | #77 | Exceptional 48.1% |
| Immigrants | Belgium | 97.1 /100 | #78 | Exceptional 48.1% |
| Immigrants | South Africa | 97.0 /100 | #79 | Exceptional 48.1% |
| Immigrants | Poland | 96.9 /100 | #80 | Exceptional 48.1% |
| Immigrants | Sri Lanka | 96.9 /100 | #81 | Exceptional 48.1% |
| Immigrants | Europe | 96.9 /100 | #82 | Exceptional 48.1% |
| Bolivians | 96.9 /100 | #83 | Exceptional 48.1% |
| Immigrants | Israel | 96.9 /100 | #84 | Exceptional 48.1% |