Immigrants from Lithuania vs Canadian Currently Married
COMPARE
Immigrants from Lithuania
Canadian
Currently Married
Currently Married Comparison
Immigrants from Lithuania
Canadians
48.8%
CURRENTLY MARRIED
99.4/ 100
METRIC RATING
34th/ 347
METRIC RANK
48.3%
CURRENTLY MARRIED
98.1/ 100
METRIC RATING
69th/ 347
METRIC RANK
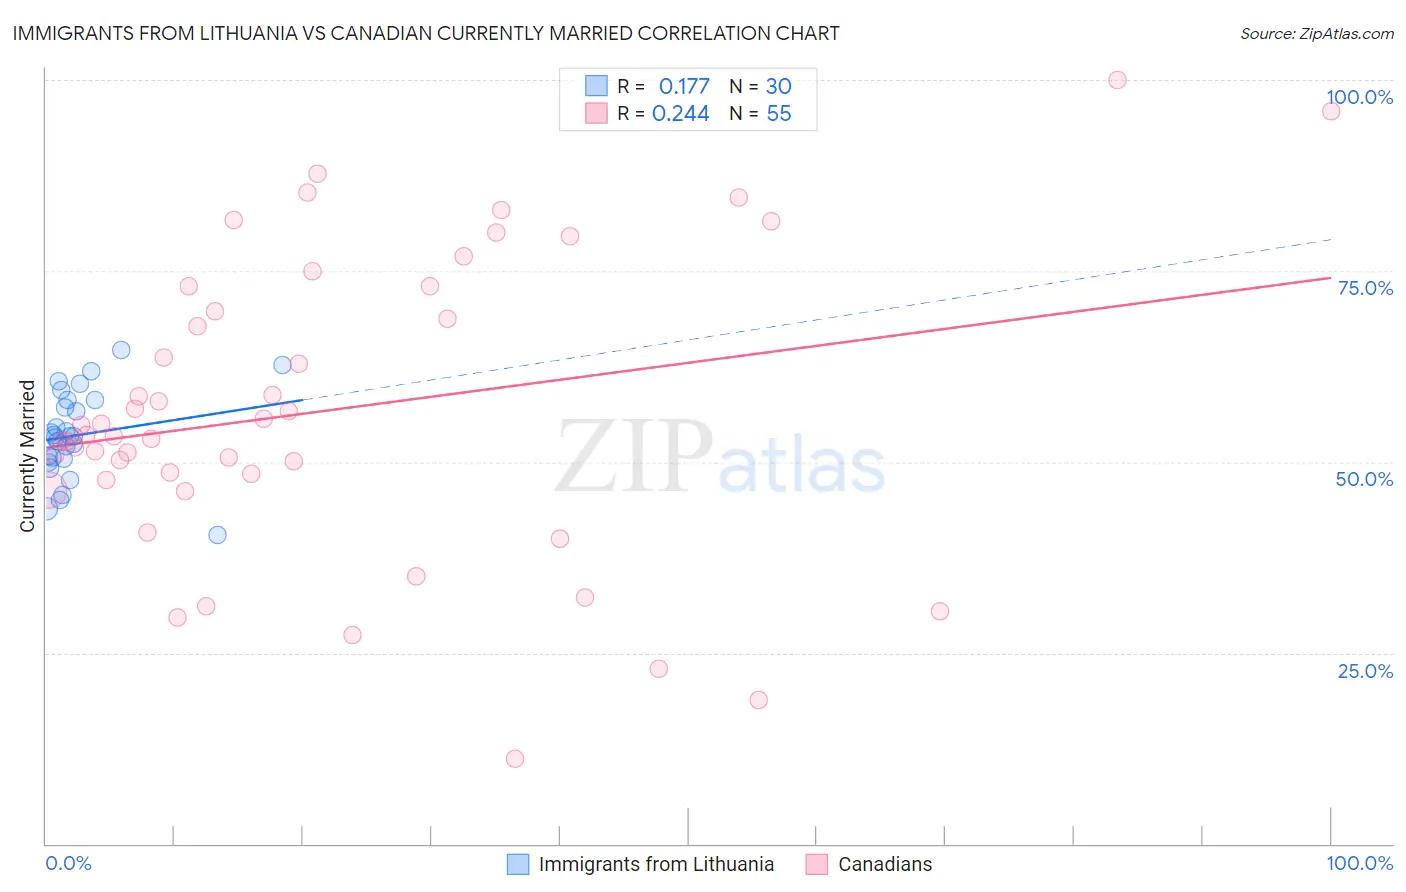
Immigrants from Lithuania vs Canadian Currently Married Correlation Chart
The statistical analysis conducted on geographies consisting of 117,724,932 people shows a poor positive correlation between the proportion of Immigrants from Lithuania and percentage of population currently married in the United States with a correlation coefficient (R) of 0.177 and weighted average of 48.8%. Similarly, the statistical analysis conducted on geographies consisting of 437,507,905 people shows a weak positive correlation between the proportion of Canadians and percentage of population currently married in the United States with a correlation coefficient (R) of 0.244 and weighted average of 48.3%, a difference of 1.1%.
Currently Married Correlation Summary
| Measurement | Immigrants from Lithuania | Canadian |
| Minimum | 40.5% | 11.1% |
| Maximum | 64.7% | 100.0% |
| Range | 24.2% | 88.9% |
| Mean | 53.5% | 56.8% |
| Median | 53.4% | 53.5% |
| Interquartile 25% (IQ1) | 50.4% | 47.6% |
| Interquartile 75% (IQ3) | 58.1% | 73.0% |
| Interquartile Range (IQR) | 7.8% | 25.3% |
| Standard Deviation (Sample) | 5.8% | 19.6% |
| Standard Deviation (Population) | 5.7% | 19.4% |
Similar Demographics by Currently Married
Demographics Similar to Immigrants from Lithuania by Currently Married
In terms of currently married, the demographic groups most similar to Immigrants from Lithuania are Immigrants from Northern Europe (48.8%, a difference of 0.020%), Italian (48.8%, a difference of 0.030%), Hungarian (48.8%, a difference of 0.030%), Irish (48.9%, a difference of 0.060%), and Czechoslovakian (48.8%, a difference of 0.070%).
| Demographics | Rating | Rank | Currently Married |
| Burmese | 99.6 /100 | #27 | Exceptional 48.9% |
| Welsh | 99.5 /100 | #28 | Exceptional 48.9% |
| Croatians | 99.5 /100 | #29 | Exceptional 48.9% |
| Eastern Europeans | 99.5 /100 | #30 | Exceptional 48.9% |
| Poles | 99.5 /100 | #31 | Exceptional 48.9% |
| Immigrants | Hong Kong | 99.5 /100 | #32 | Exceptional 48.9% |
| Irish | 99.5 /100 | #33 | Exceptional 48.9% |
| Immigrants | Lithuania | 99.4 /100 | #34 | Exceptional 48.8% |
| Immigrants | Northern Europe | 99.4 /100 | #35 | Exceptional 48.8% |
| Italians | 99.4 /100 | #36 | Exceptional 48.8% |
| Hungarians | 99.4 /100 | #37 | Exceptional 48.8% |
| Czechoslovakians | 99.4 /100 | #38 | Exceptional 48.8% |
| British | 99.4 /100 | #39 | Exceptional 48.8% |
| Immigrants | Canada | 99.4 /100 | #40 | Exceptional 48.8% |
| Greeks | 99.3 /100 | #41 | Exceptional 48.8% |
Demographics Similar to Canadians by Currently Married
In terms of currently married, the demographic groups most similar to Canadians are Slovak (48.3%, a difference of 0.020%), Immigrants from England (48.3%, a difference of 0.020%), Tongan (48.3%, a difference of 0.040%), Immigrants from Czechoslovakia (48.4%, a difference of 0.070%), and Ukrainian (48.4%, a difference of 0.070%).
| Demographics | Rating | Rank | Currently Married |
| Asians | 98.5 /100 | #62 | Exceptional 48.4% |
| Slavs | 98.3 /100 | #63 | Exceptional 48.4% |
| Immigrants | Czechoslovakia | 98.3 /100 | #64 | Exceptional 48.4% |
| Ukrainians | 98.3 /100 | #65 | Exceptional 48.4% |
| Tongans | 98.2 /100 | #66 | Exceptional 48.3% |
| Slovaks | 98.2 /100 | #67 | Exceptional 48.3% |
| Immigrants | England | 98.2 /100 | #68 | Exceptional 48.3% |
| Canadians | 98.1 /100 | #69 | Exceptional 48.3% |
| Immigrants | Asia | 97.9 /100 | #70 | Exceptional 48.3% |
| Macedonians | 97.9 /100 | #71 | Exceptional 48.3% |
| Immigrants | Lebanon | 97.6 /100 | #72 | Exceptional 48.2% |
| Immigrants | Eastern Asia | 97.5 /100 | #73 | Exceptional 48.2% |
| Estonians | 97.4 /100 | #74 | Exceptional 48.2% |
| Immigrants | Belarus | 97.2 /100 | #75 | Exceptional 48.1% |
| Basques | 97.2 /100 | #76 | Exceptional 48.1% |