Immigrants from Philippines vs Immigrants from Albania Married-couple Households
COMPARE
Immigrants from Philippines
Immigrants from Albania
Married-couple Households
Married-couple Households Comparison
Immigrants from Philippines
Immigrants from Albania
49.3%
MARRIED-COUPLE HOUSEHOLDS
99.9/ 100
METRIC RATING
25th/ 347
METRIC RANK
44.4%
MARRIED-COUPLE HOUSEHOLDS
1.0/ 100
METRIC RATING
242nd/ 347
METRIC RANK
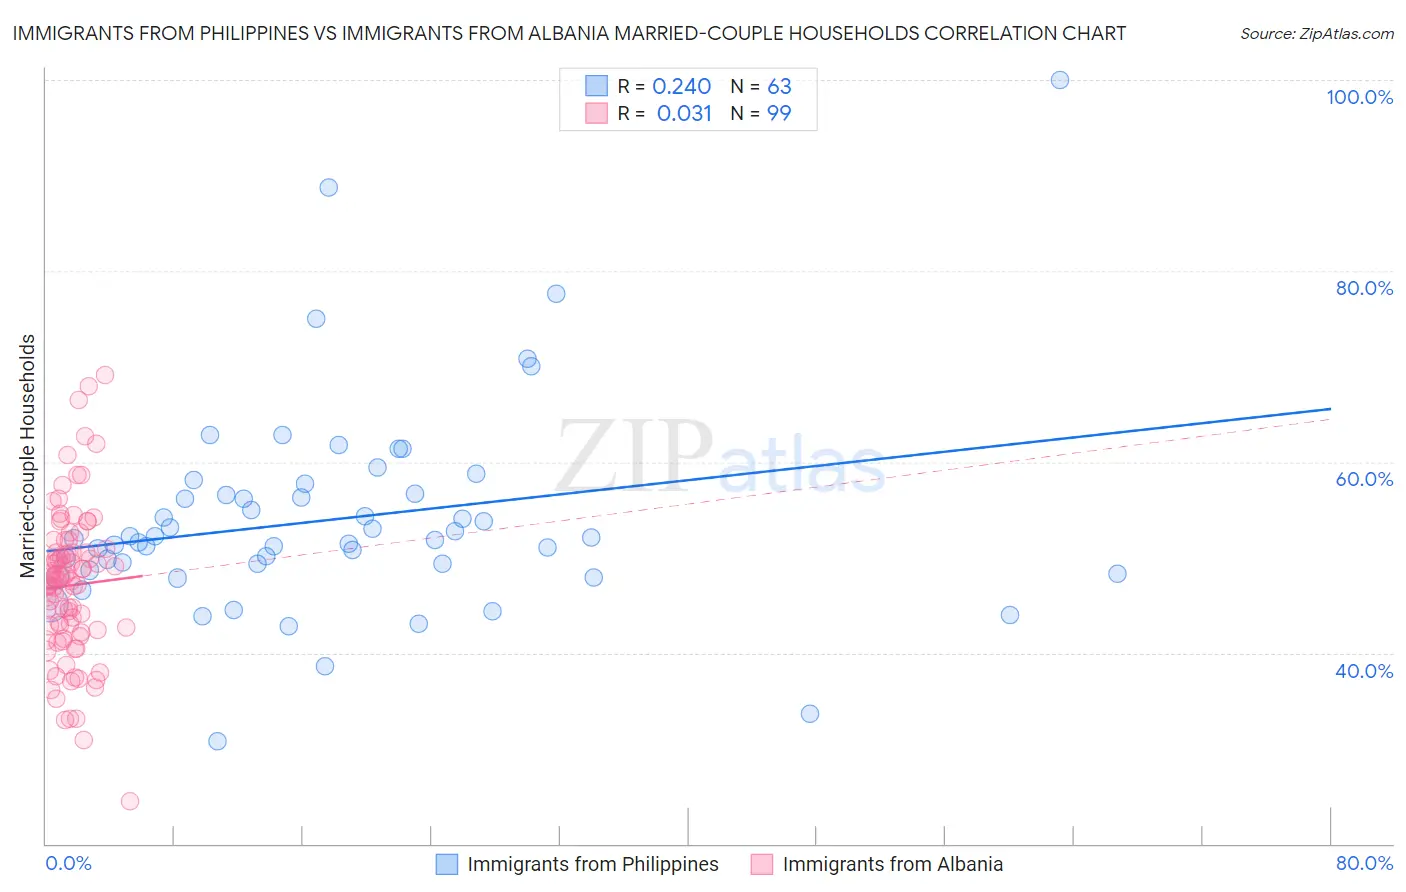
Immigrants from Philippines vs Immigrants from Albania Married-couple Households Correlation Chart
The statistical analysis conducted on geographies consisting of 471,010,900 people shows a weak positive correlation between the proportion of Immigrants from Philippines and percentage of married-couple family households in the United States with a correlation coefficient (R) of 0.240 and weighted average of 49.3%. Similarly, the statistical analysis conducted on geographies consisting of 119,383,494 people shows no correlation between the proportion of Immigrants from Albania and percentage of married-couple family households in the United States with a correlation coefficient (R) of 0.031 and weighted average of 44.4%, a difference of 11.0%.
Married-couple Households Correlation Summary
| Measurement | Immigrants from Philippines | Immigrants from Albania |
| Minimum | 30.7% | 24.4% |
| Maximum | 100.0% | 69.1% |
| Range | 69.3% | 44.7% |
| Mean | 54.0% | 47.0% |
| Median | 51.9% | 47.6% |
| Interquartile 25% (IQ1) | 48.6% | 42.1% |
| Interquartile 75% (IQ3) | 56.6% | 50.5% |
| Interquartile Range (IQR) | 8.0% | 8.4% |
| Standard Deviation (Sample) | 11.1% | 7.9% |
| Standard Deviation (Population) | 11.0% | 7.8% |
Similar Demographics by Married-couple Households
Demographics Similar to Immigrants from Philippines by Married-couple Households
In terms of married-couple households, the demographic groups most similar to Immigrants from Philippines are Immigrants from Scotland (49.3%, a difference of 0.13%), Bhutanese (49.3%, a difference of 0.15%), Czech (49.4%, a difference of 0.19%), Dutch (49.5%, a difference of 0.27%), and Asian (49.5%, a difference of 0.28%).
| Demographics | Rating | Rank | Married-couple Households |
| English | 99.9 /100 | #18 | Exceptional 49.6% |
| Europeans | 99.9 /100 | #19 | Exceptional 49.6% |
| Scandinavians | 99.9 /100 | #20 | Exceptional 49.6% |
| Norwegians | 99.9 /100 | #21 | Exceptional 49.5% |
| Asians | 99.9 /100 | #22 | Exceptional 49.5% |
| Dutch | 99.9 /100 | #23 | Exceptional 49.5% |
| Czechs | 99.9 /100 | #24 | Exceptional 49.4% |
| Immigrants | Philippines | 99.9 /100 | #25 | Exceptional 49.3% |
| Immigrants | Scotland | 99.8 /100 | #26 | Exceptional 49.3% |
| Bhutanese | 99.8 /100 | #27 | Exceptional 49.3% |
| Germans | 99.8 /100 | #28 | Exceptional 49.2% |
| Maltese | 99.8 /100 | #29 | Exceptional 49.2% |
| Bolivians | 99.8 /100 | #30 | Exceptional 49.2% |
| Native Hawaiians | 99.8 /100 | #31 | Exceptional 49.1% |
| Hungarians | 99.8 /100 | #32 | Exceptional 49.1% |
Demographics Similar to Immigrants from Albania by Married-couple Households
In terms of married-couple households, the demographic groups most similar to Immigrants from Albania are Ute (44.4%, a difference of 0.040%), Immigrants from Bosnia and Herzegovina (44.4%, a difference of 0.040%), Immigrants from Saudi Arabia (44.4%, a difference of 0.070%), Spanish American (44.5%, a difference of 0.12%), and Immigrants from Uruguay (44.5%, a difference of 0.14%).
| Demographics | Rating | Rank | Married-couple Households |
| Immigrants | Nicaragua | 1.2 /100 | #235 | Tragic 44.5% |
| Yaqui | 1.2 /100 | #236 | Tragic 44.5% |
| Comanche | 1.2 /100 | #237 | Tragic 44.5% |
| Immigrants | Uruguay | 1.1 /100 | #238 | Tragic 44.5% |
| Spanish Americans | 1.1 /100 | #239 | Tragic 44.5% |
| Ute | 1.0 /100 | #240 | Tragic 44.4% |
| Immigrants | Bosnia and Herzegovina | 1.0 /100 | #241 | Tragic 44.4% |
| Immigrants | Albania | 1.0 /100 | #242 | Tragic 44.4% |
| Immigrants | Saudi Arabia | 0.9 /100 | #243 | Tragic 44.4% |
| Immigrants | Armenia | 0.7 /100 | #244 | Tragic 44.3% |
| Immigrants | El Salvador | 0.7 /100 | #245 | Tragic 44.3% |
| Immigrants | Cuba | 0.6 /100 | #246 | Tragic 44.2% |
| Immigrants | Morocco | 0.6 /100 | #247 | Tragic 44.2% |
| Yup'ik | 0.4 /100 | #248 | Tragic 44.1% |
| Immigrants | Kenya | 0.4 /100 | #249 | Tragic 44.1% |