Immigrants from Panama vs Pima Married-couple Households
COMPARE
Immigrants from Panama
Pima
Married-couple Households
Married-couple Households Comparison
Immigrants from Panama
Pima
44.6%
MARRIED-COUPLE HOUSEHOLDS
1.3/ 100
METRIC RATING
234th/ 347
METRIC RANK
35.6%
MARRIED-COUPLE HOUSEHOLDS
0.0/ 100
METRIC RATING
347th/ 347
METRIC RANK
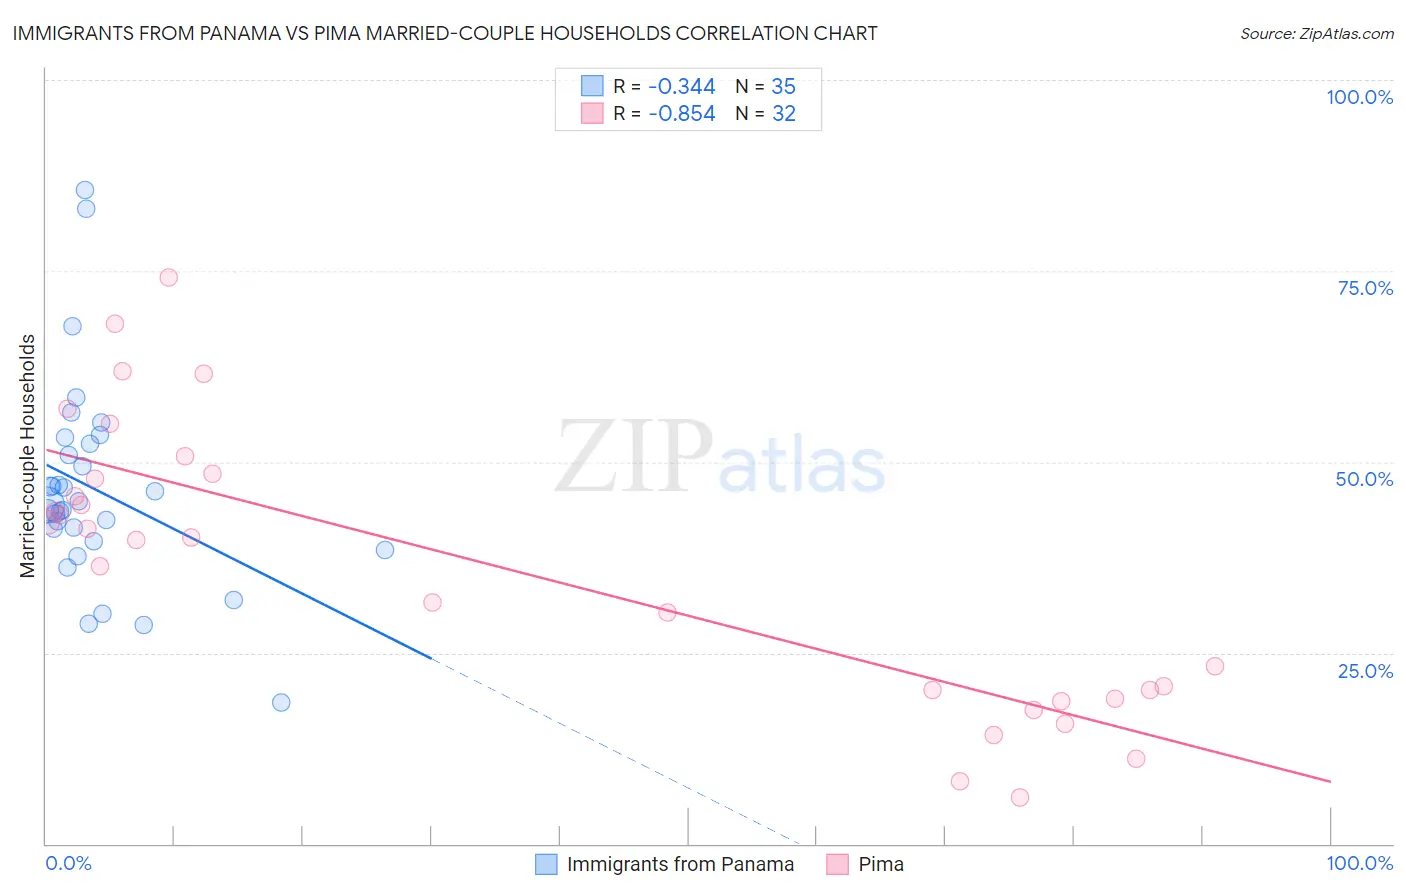
Immigrants from Panama vs Pima Married-couple Households Correlation Chart
The statistical analysis conducted on geographies consisting of 221,156,465 people shows a mild negative correlation between the proportion of Immigrants from Panama and percentage of married-couple family households in the United States with a correlation coefficient (R) of -0.344 and weighted average of 44.6%. Similarly, the statistical analysis conducted on geographies consisting of 61,538,795 people shows a very strong negative correlation between the proportion of Pima and percentage of married-couple family households in the United States with a correlation coefficient (R) of -0.854 and weighted average of 35.6%, a difference of 25.3%.
Married-couple Households Correlation Summary
| Measurement | Immigrants from Panama | Pima |
| Minimum | 18.6% | 6.1% |
| Maximum | 85.7% | 74.1% |
| Range | 67.1% | 68.0% |
| Mean | 46.3% | 36.2% |
| Median | 44.4% | 40.0% |
| Interquartile 25% (IQ1) | 39.6% | 19.6% |
| Interquartile 75% (IQ3) | 52.4% | 48.1% |
| Interquartile Range (IQR) | 12.9% | 28.5% |
| Standard Deviation (Sample) | 13.4% | 18.4% |
| Standard Deviation (Population) | 13.2% | 18.1% |
Similar Demographics by Married-couple Households
Demographics Similar to Immigrants from Panama by Married-couple Households
In terms of married-couple households, the demographic groups most similar to Immigrants from Panama are Immigrants from Nicaragua (44.5%, a difference of 0.070%), Yaqui (44.5%, a difference of 0.080%), Comanche (44.5%, a difference of 0.11%), Immigrants from Uganda (44.6%, a difference of 0.12%), and Houma (44.6%, a difference of 0.16%).
| Demographics | Rating | Rank | Married-couple Households |
| Salvadorans | 1.9 /100 | #227 | Tragic 44.7% |
| Kenyans | 1.7 /100 | #228 | Tragic 44.7% |
| Immigrants | Latin America | 1.6 /100 | #229 | Tragic 44.7% |
| Soviet Union | 1.6 /100 | #230 | Tragic 44.6% |
| Houma | 1.5 /100 | #231 | Tragic 44.6% |
| Marshallese | 1.5 /100 | #232 | Tragic 44.6% |
| Immigrants | Uganda | 1.5 /100 | #233 | Tragic 44.6% |
| Immigrants | Panama | 1.3 /100 | #234 | Tragic 44.6% |
| Immigrants | Nicaragua | 1.2 /100 | #235 | Tragic 44.5% |
| Yaqui | 1.2 /100 | #236 | Tragic 44.5% |
| Comanche | 1.2 /100 | #237 | Tragic 44.5% |
| Immigrants | Uruguay | 1.1 /100 | #238 | Tragic 44.5% |
| Spanish Americans | 1.1 /100 | #239 | Tragic 44.5% |
| Ute | 1.0 /100 | #240 | Tragic 44.4% |
| Immigrants | Bosnia and Herzegovina | 1.0 /100 | #241 | Tragic 44.4% |
Demographics Similar to Pima by Married-couple Households
In terms of married-couple households, the demographic groups most similar to Pima are Immigrants from Cabo Verde (36.2%, a difference of 1.9%), Hopi (36.7%, a difference of 3.2%), Immigrants from Dominican Republic (37.3%, a difference of 5.0%), Immigrants from Grenada (37.5%, a difference of 5.5%), and Tohono O'odham (37.9%, a difference of 6.6%).
| Demographics | Rating | Rank | Married-couple Households |
| Immigrants | West Indies | 0.0 /100 | #333 | Tragic 39.0% |
| Immigrants | St. Vincent and the Grenadines | 0.0 /100 | #334 | Tragic 38.7% |
| Senegalese | 0.0 /100 | #335 | Tragic 38.6% |
| Blacks/African Americans | 0.0 /100 | #336 | Tragic 38.5% |
| Immigrants | Somalia | 0.0 /100 | #337 | Tragic 38.4% |
| Immigrants | Senegal | 0.0 /100 | #338 | Tragic 38.4% |
| British West Indians | 0.0 /100 | #339 | Tragic 38.3% |
| Dominicans | 0.0 /100 | #340 | Tragic 38.2% |
| Cape Verdeans | 0.0 /100 | #341 | Tragic 38.1% |
| Tohono O'odham | 0.0 /100 | #342 | Tragic 37.9% |
| Immigrants | Grenada | 0.0 /100 | #343 | Tragic 37.5% |
| Immigrants | Dominican Republic | 0.0 /100 | #344 | Tragic 37.3% |
| Hopi | 0.0 /100 | #345 | Tragic 36.7% |
| Immigrants | Cabo Verde | 0.0 /100 | #346 | Tragic 36.2% |
| Pima | 0.0 /100 | #347 | Tragic 35.6% |