Immigrants from Northern Africa vs Sierra Leonean Family Households
COMPARE
Immigrants from Northern Africa
Sierra Leonean
Family Households
Family Households Comparison
Immigrants from Northern Africa
Sierra Leoneans
63.5%
FAMILY HOUSEHOLDS
2.6/ 100
METRIC RATING
232nd/ 347
METRIC RANK
63.9%
FAMILY HOUSEHOLDS
11.2/ 100
METRIC RATING
209th/ 347
METRIC RANK
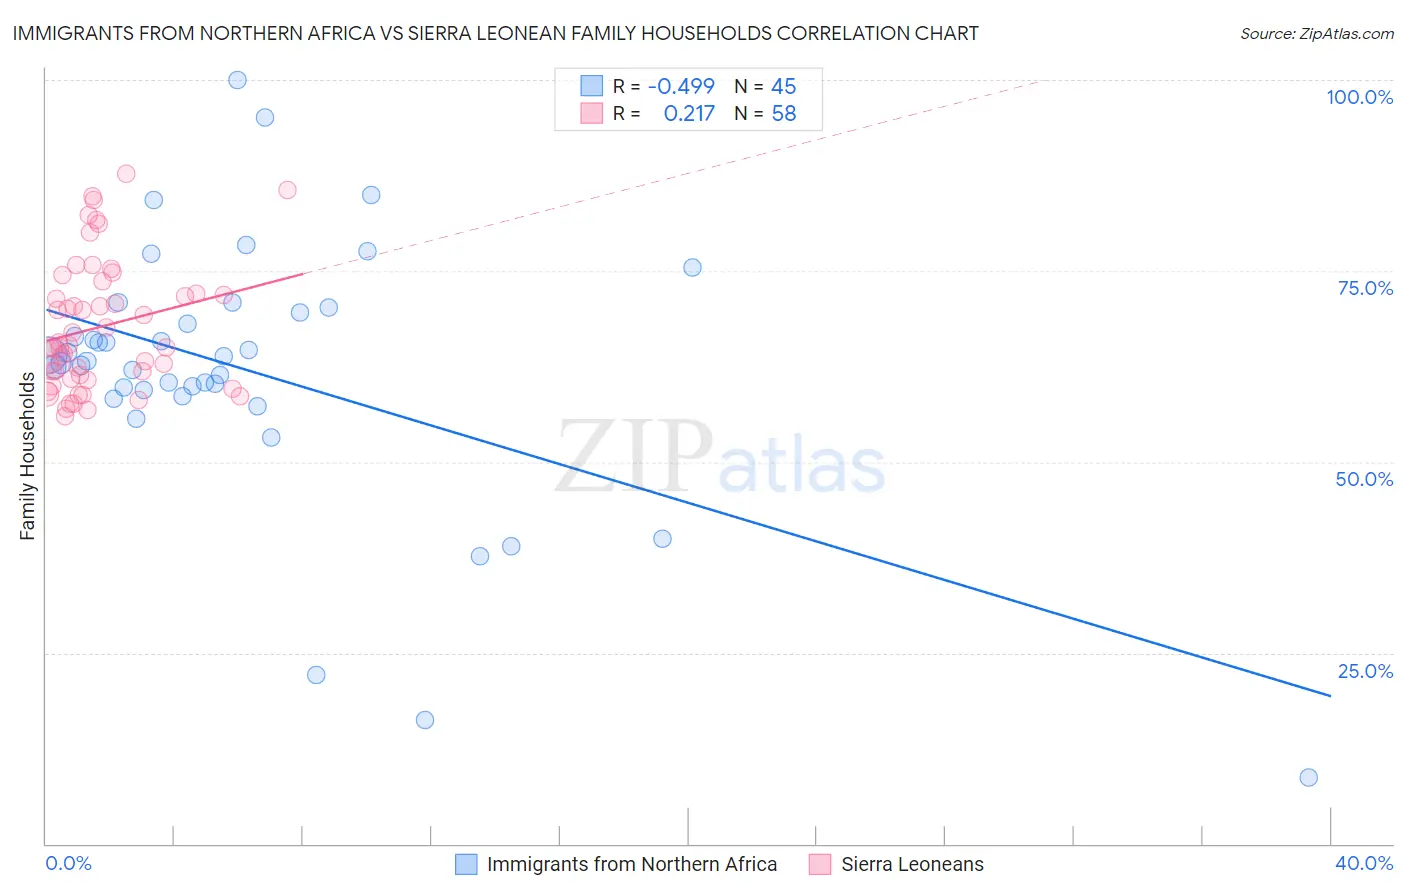
Immigrants from Northern Africa vs Sierra Leonean Family Households Correlation Chart
The statistical analysis conducted on geographies consisting of 321,089,077 people shows a moderate negative correlation between the proportion of Immigrants from Northern Africa and percentage of family households in the United States with a correlation coefficient (R) of -0.499 and weighted average of 63.5%. Similarly, the statistical analysis conducted on geographies consisting of 83,352,562 people shows a weak positive correlation between the proportion of Sierra Leoneans and percentage of family households in the United States with a correlation coefficient (R) of 0.217 and weighted average of 63.9%, a difference of 0.52%.
Family Households Correlation Summary
| Measurement | Immigrants from Northern Africa | Sierra Leonean |
| Minimum | 8.7% | 55.9% |
| Maximum | 100.0% | 87.8% |
| Range | 91.3% | 31.8% |
| Mean | 62.0% | 67.7% |
| Median | 63.2% | 65.2% |
| Interquartile 25% (IQ1) | 59.0% | 60.8% |
| Interquartile 75% (IQ3) | 69.9% | 72.0% |
| Interquartile Range (IQR) | 10.8% | 11.2% |
| Standard Deviation (Sample) | 17.3% | 8.4% |
| Standard Deviation (Population) | 17.2% | 8.4% |
Similar Demographics by Family Households
Demographics Similar to Immigrants from Northern Africa by Family Households
In terms of family households, the demographic groups most similar to Immigrants from Northern Africa are Immigrants from Armenia (63.5%, a difference of 0.010%), Immigrants from Greece (63.5%, a difference of 0.030%), Finnish (63.5%, a difference of 0.040%), Immigrants from Brazil (63.6%, a difference of 0.050%), and Albanian (63.5%, a difference of 0.070%).
| Demographics | Rating | Rank | Family Households |
| Immigrants | Hungary | 4.3 /100 | #225 | Tragic 63.6% |
| Immigrants | Bahamas | 4.2 /100 | #226 | Tragic 63.6% |
| Trinidadians and Tobagonians | 4.1 /100 | #227 | Tragic 63.6% |
| Blackfeet | 3.6 /100 | #228 | Tragic 63.6% |
| Bulgarians | 3.4 /100 | #229 | Tragic 63.6% |
| Immigrants | Brazil | 3.0 /100 | #230 | Tragic 63.6% |
| Immigrants | Greece | 2.9 /100 | #231 | Tragic 63.5% |
| Immigrants | Northern Africa | 2.6 /100 | #232 | Tragic 63.5% |
| Immigrants | Armenia | 2.6 /100 | #233 | Tragic 63.5% |
| Finns | 2.3 /100 | #234 | Tragic 63.5% |
| Albanians | 2.2 /100 | #235 | Tragic 63.5% |
| Ghanaians | 2.1 /100 | #236 | Tragic 63.5% |
| Comanche | 2.1 /100 | #237 | Tragic 63.5% |
| Immigrants | Zimbabwe | 2.0 /100 | #238 | Tragic 63.5% |
| Aleuts | 1.9 /100 | #239 | Tragic 63.4% |
Demographics Similar to Sierra Leoneans by Family Households
In terms of family households, the demographic groups most similar to Sierra Leoneans are Nigerian (63.9%, a difference of 0.010%), Immigrants from Bangladesh (63.9%, a difference of 0.010%), Immigrants from Lithuania (63.9%, a difference of 0.030%), Brazilian (63.9%, a difference of 0.040%), and Immigrants from Uruguay (63.9%, a difference of 0.050%).
| Demographics | Rating | Rank | Family Households |
| Iranians | 13.5 /100 | #202 | Poor 63.9% |
| Norwegians | 13.2 /100 | #203 | Poor 63.9% |
| Immigrants | Uruguay | 12.8 /100 | #204 | Poor 63.9% |
| Brazilians | 12.4 /100 | #205 | Poor 63.9% |
| Immigrants | Lithuania | 12.1 /100 | #206 | Poor 63.9% |
| Nigerians | 11.5 /100 | #207 | Poor 63.9% |
| Immigrants | Bangladesh | 11.4 /100 | #208 | Poor 63.9% |
| Sierra Leoneans | 11.2 /100 | #209 | Poor 63.9% |
| Immigrants | Thailand | 9.6 /100 | #210 | Tragic 63.8% |
| Shoshone | 9.4 /100 | #211 | Tragic 63.8% |
| Immigrants | Netherlands | 9.4 /100 | #212 | Tragic 63.8% |
| Immigrants | Northern Europe | 8.8 /100 | #213 | Tragic 63.8% |
| Celtics | 8.0 /100 | #214 | Tragic 63.8% |
| Belgians | 7.6 /100 | #215 | Tragic 63.8% |
| Croatians | 7.3 /100 | #216 | Tragic 63.8% |