Immigrants from Nigeria vs Immigrants from Bolivia Average Family Size
COMPARE
Immigrants from Nigeria
Immigrants from Bolivia
Average Family Size
Average Family Size Comparison
Immigrants from Nigeria
Immigrants from Bolivia
3.32
AVERAGE FAMILY SIZE
99.7/ 100
METRIC RATING
84th/ 347
METRIC RANK
3.31
AVERAGE FAMILY SIZE
99.6/ 100
METRIC RATING
88th/ 347
METRIC RANK
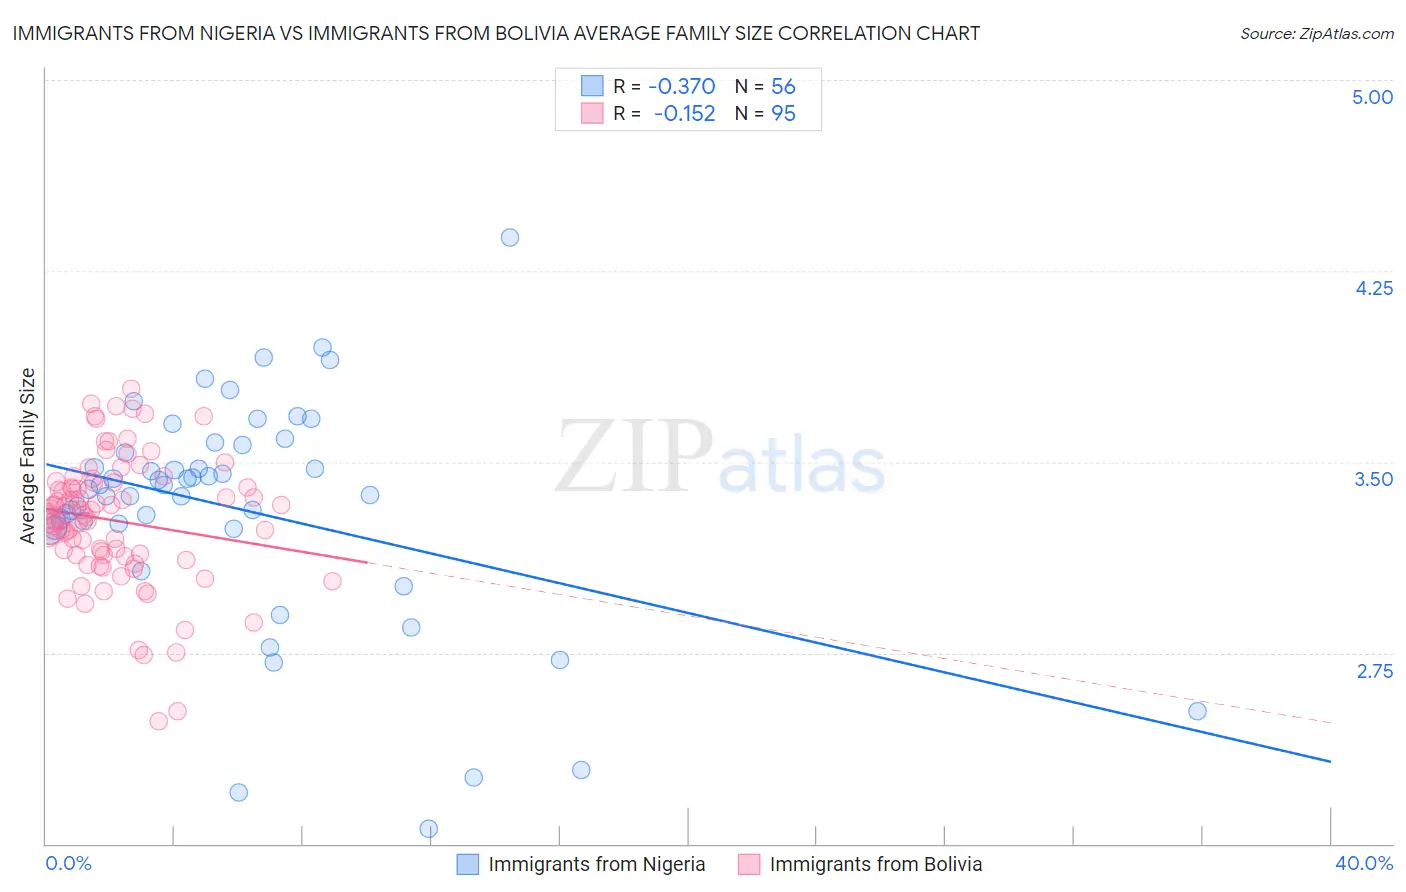
Immigrants from Nigeria vs Immigrants from Bolivia Average Family Size Correlation Chart
The statistical analysis conducted on geographies consisting of 283,303,904 people shows a mild negative correlation between the proportion of Immigrants from Nigeria and average family size in the United States with a correlation coefficient (R) of -0.370 and weighted average of 3.32. Similarly, the statistical analysis conducted on geographies consisting of 158,712,617 people shows a poor negative correlation between the proportion of Immigrants from Bolivia and average family size in the United States with a correlation coefficient (R) of -0.152 and weighted average of 3.31, a difference of 0.20%.
Average Family Size Correlation Summary
| Measurement | Immigrants from Nigeria | Immigrants from Bolivia |
| Minimum | 2.06 | 2.48 |
| Maximum | 4.38 | 3.79 |
| Range | 2.32 | 1.31 |
| Mean | 3.31 | 3.27 |
| Median | 3.40 | 3.29 |
| Interquartile 25% (IQ1) | 3.24 | 3.13 |
| Interquartile 75% (IQ3) | 3.55 | 3.42 |
| Interquartile Range (IQR) | 0.31 | 0.28 |
| Standard Deviation (Sample) | 0.45 | 0.25 |
| Standard Deviation (Population) | 0.44 | 0.25 |
Demographics Similar to Immigrants from Nigeria and Immigrants from Bolivia by Average Family Size
In terms of average family size, the demographic groups most similar to Immigrants from Nigeria are Immigrants from Afghanistan (3.32, a difference of 0.030%), Afghan (3.31, a difference of 0.040%), Ecuadorian (3.32, a difference of 0.050%), Jamaican (3.31, a difference of 0.060%), and Immigrants from Dominica (3.32, a difference of 0.080%). Similarly, the demographic groups most similar to Immigrants from Bolivia are Malaysian (3.31, a difference of 0.010%), Immigrants from Peru (3.31, a difference of 0.090%), Menominee (3.30, a difference of 0.12%), Jamaican (3.31, a difference of 0.14%), and Afghan (3.31, a difference of 0.16%).
| Demographics | Rating | Rank | Average Family Size |
| Trinidadians and Tobagonians | 99.8 /100 | #76 | Exceptional 3.32 |
| Immigrants | Ecuador | 99.8 /100 | #77 | Exceptional 3.32 |
| Immigrants | Micronesia | 99.8 /100 | #78 | Exceptional 3.32 |
| British West Indians | 99.8 /100 | #79 | Exceptional 3.32 |
| Lumbee | 99.8 /100 | #80 | Exceptional 3.32 |
| Immigrants | Dominica | 99.8 /100 | #81 | Exceptional 3.32 |
| Ecuadorians | 99.8 /100 | #82 | Exceptional 3.32 |
| Immigrants | Afghanistan | 99.8 /100 | #83 | Exceptional 3.32 |
| Immigrants | Nigeria | 99.7 /100 | #84 | Exceptional 3.32 |
| Afghans | 99.7 /100 | #85 | Exceptional 3.31 |
| Jamaicans | 99.7 /100 | #86 | Exceptional 3.31 |
| Immigrants | Peru | 99.7 /100 | #87 | Exceptional 3.31 |
| Immigrants | Bolivia | 99.6 /100 | #88 | Exceptional 3.31 |
| Malaysians | 99.6 /100 | #89 | Exceptional 3.31 |
| Menominee | 99.4 /100 | #90 | Exceptional 3.30 |
| Immigrants | Pakistan | 99.2 /100 | #91 | Exceptional 3.30 |
| Immigrants | Cameroon | 99.2 /100 | #92 | Exceptional 3.30 |
| Peruvians | 99.2 /100 | #93 | Exceptional 3.30 |
| Sierra Leoneans | 99.0 /100 | #94 | Exceptional 3.30 |
| Immigrants | Lebanon | 99.0 /100 | #95 | Exceptional 3.30 |
| U.S. Virgin Islanders | 98.8 /100 | #96 | Exceptional 3.29 |